
Findings
Four widely followed conditions, tested on the NASDAQ Composite against 1,000 synthetic markets. Each one looks convincing on a chart of history. None of them clears.
Reading a figure
Every figure has two panels. Left: for each move size (vertical) and number of days ahead (horizontal), how much more often (red) or less often (blue) the market reached that level while the condition held, compared with all days. The circled cells mark the largest swing between a rise and a fall of the same size. Right: the condition’s score (blue line) among the scores of 1,000 synthetic markets (gray bars). To clear, it has to sit right of the dashed line (the synthetic 95th percentile).
The header of each figure states the range of the condition, its score, the 95th percentile it had to beat, and its p-value: the share of synthetic markets that scored at least as high.
1The golden cross
Traders watch for the 50-day average to cross above the 200-day. Once it’s running about 10% above, the left panel looks pretty decisive: the odds of a 4% drop rise, the odds of a 4% rise fall — a 24.5-point swing. Synthetic markets with no memory turn out one at least this strong 8.4% of the time.
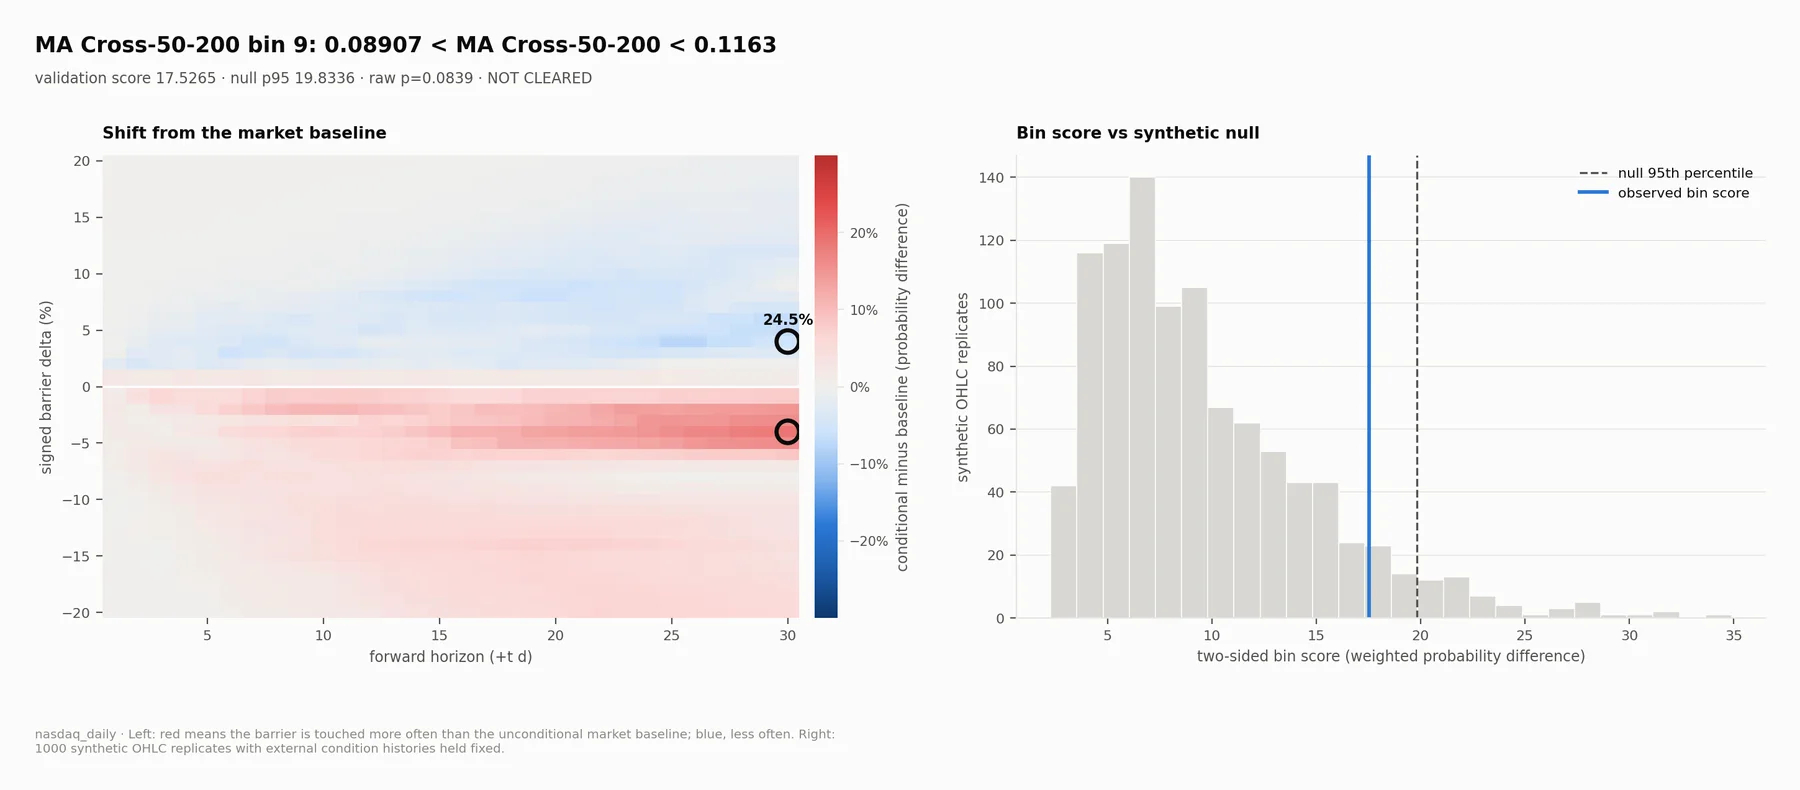
Score 17.53; synthetic 95th percentile 19.83; p = 0.084. Not cleared.
2Above the 200-day average
“Stay long while price is above the 200-day” is more or less trend following’s first rule. With price 4% to 6% above it, the picture is a near-perfect mirror: rises more likely, drops much less likely — a 27.4-point swing, the largest of the two moving-average conditions. Still, its score sits well inside the synthetic range, 23% of signal-free markets match it.
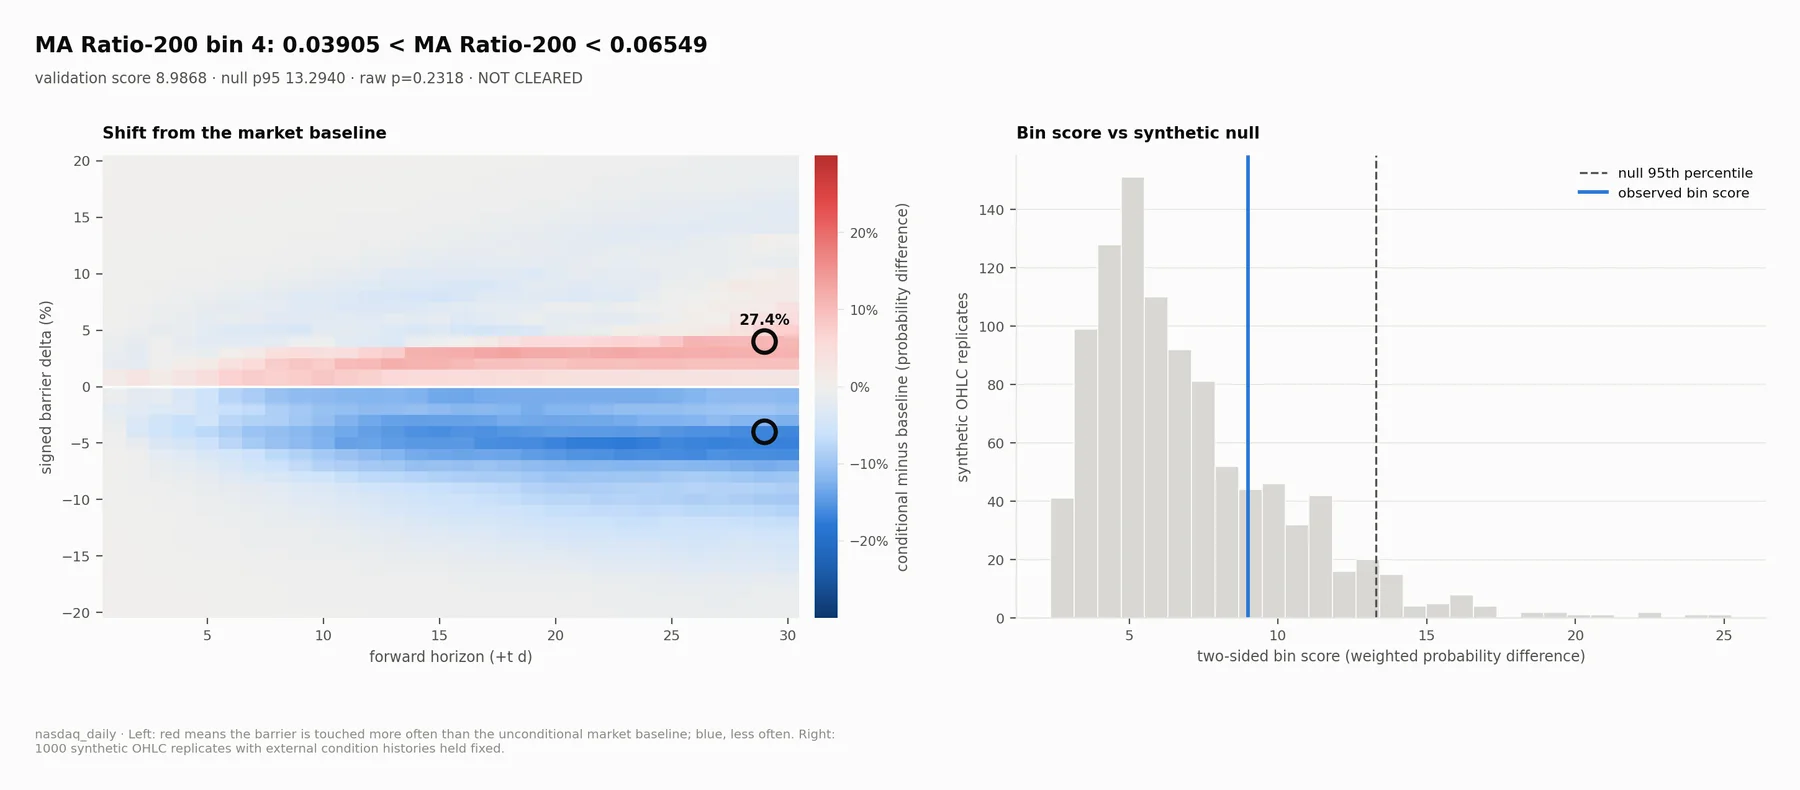
Score 8.99; synthetic 95th percentile 13.29; p = 0.232. Not cleared.
A big swing and a low score don’t contradict each other. The score weighs the whole grid of moves and horizons, and gives more weight to larger moves; a swing packed into a few cells can be big and still be ordinary. The method defines the score.
3Low bond yields
Cheap money lifts stocks, or so the saying goes. With the 10-year Treasury yield below 1.34%, the NASDAQ was far more likely to rally 8% within a month: a 42-point swing that grows steadily with time. It comes closest of the four to clearing and still falls short: 7.6% of synthetic markets match it.
The yield is outside data, so it is held fixed on every synthetic market; only the NASDAQ’s own path is randomized. So the test is asking whether these particular dates were followed by unusual moves more often than chance would put them there.
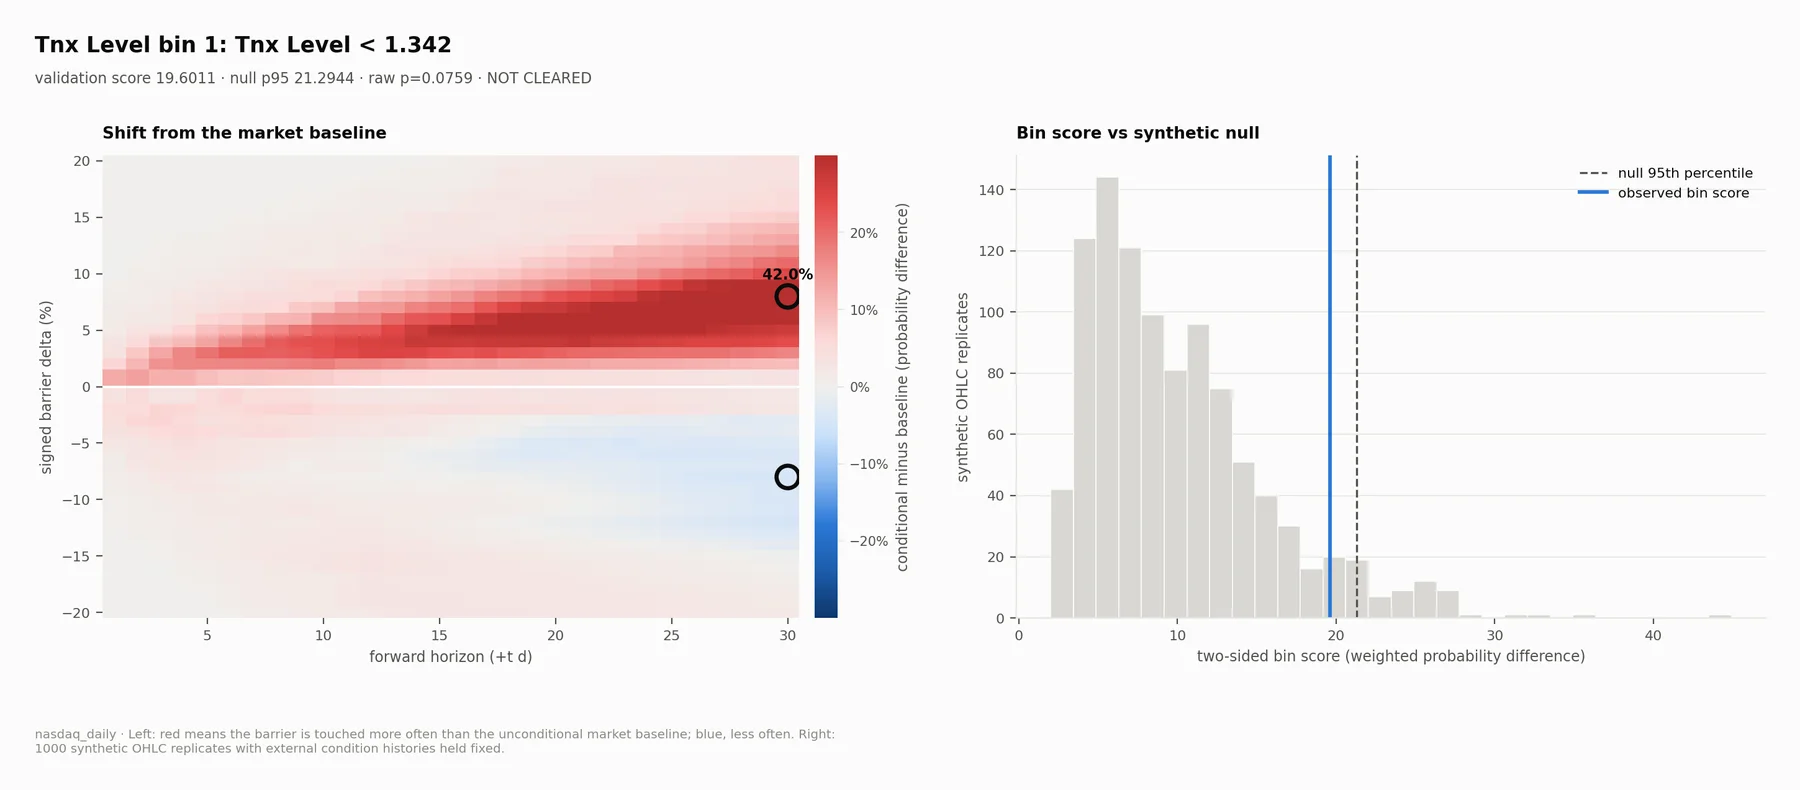
Score 19.60; synthetic 95th percentile 21.29; p = 0.076. Not cleared.
4Moderate yields
Move the yield to 2.5%–2.9% and the story flips: an 8% drop becomes likelier than a rise — a 21.2-point swing. Taken on its own, it looks like a second, bearish regime. It’s the weakest of the four: 41% of synthetic markets match it.
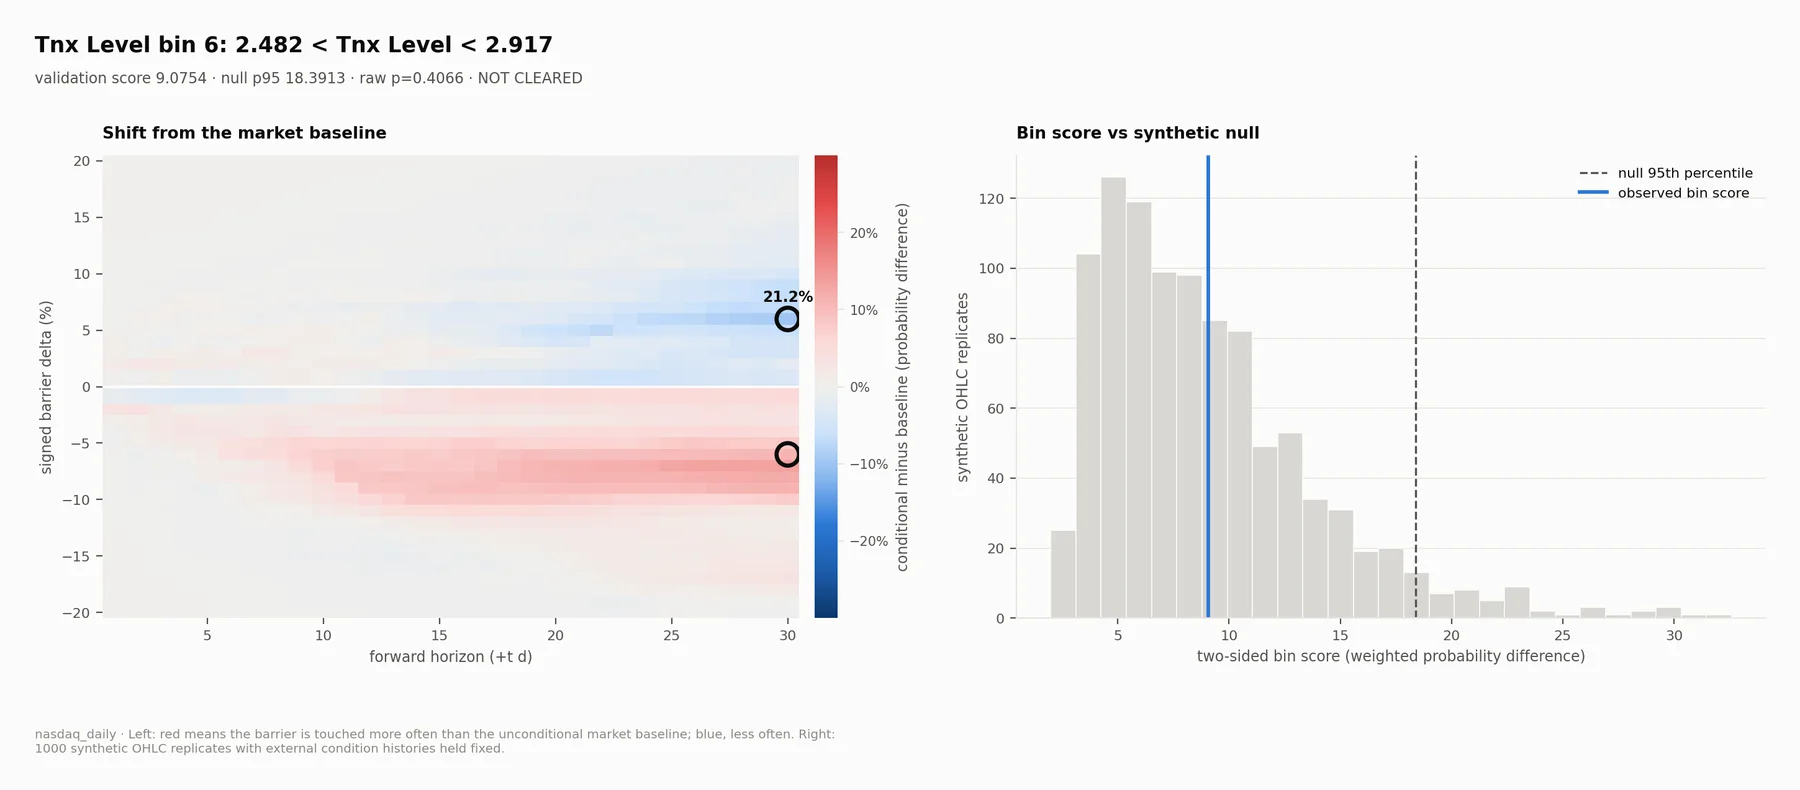
Score 9.08; synthetic 95th percentile 18.39; p = 0.407. Not cleared.
Summary
| Condition | Swing | Score | Needed (95th pct.) | p |
|---|---|---|---|---|
| Golden cross, 8.9%–11.6% | 24.5 pts | 17.53 | 19.83 | 0.084 |
| Price vs. 200-day, 3.9%–6.5% | 27.4 pts | 8.99 | 13.29 | 0.232 |
| 10-year yield < 1.34% | 42 pts | 19.60 | 21.29 | 0.076 |
| 10-year yield 2.48%–2.92% | 21.2 pts | 9.08 | 18.39 | 0.407 |
These four bins were picked to illustrate folklore, they aren’t a summary of every bin tested. Figures are produced by AlphaVerify and reproduced unedited from the project repository (CC0); each can be regenerated with the commands on the overview.