
Open-source signal validation
AlphaVerify is an open-source framework built around one question every trading signal ought to face: does its apparent edge hold up against markets with no signal in them at all?
An edge, or something any market would produce?
Market folklore is full of conditions that supposedly change the odds: a golden cross, price above its 200-day average, unusually low bond yields. Measured on history, a lot of them do seem to shift the probability of a rise or a fall. The question is whether the shift is an edge, or something any market would produce by chance.
AlphaVerify answers it by running the same measurement on a thousand synthetic markets built with no memory, so by construction nothing in the past can predict the next day. A condition only counts if its real score beats 95% of the scores from those signal-free markets.
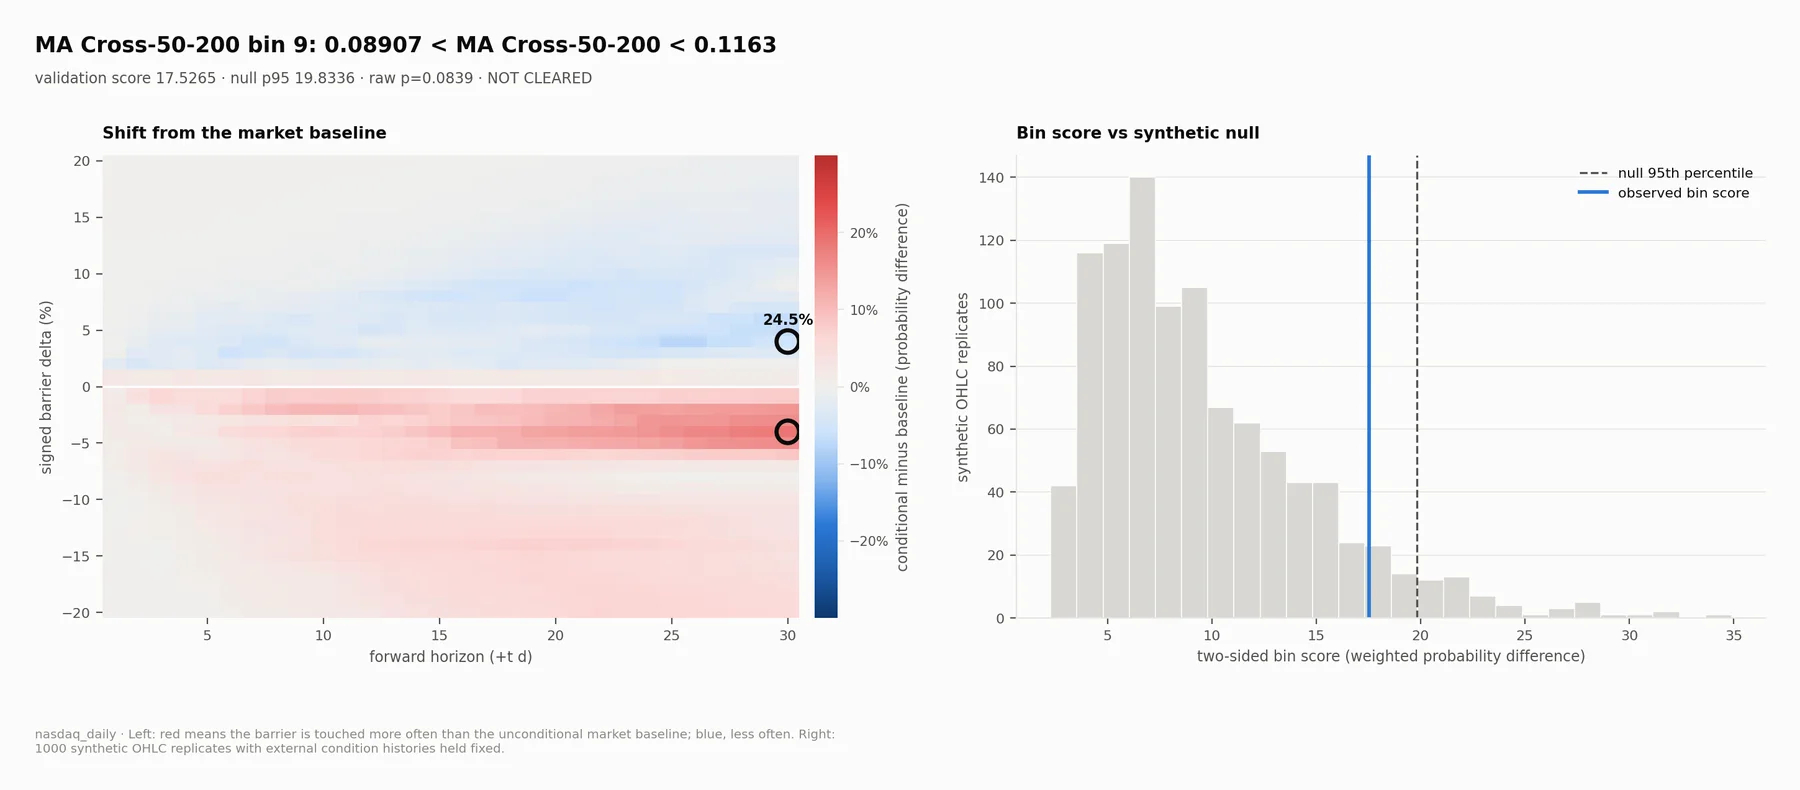
Left: shift in the odds of each move while the condition holds. Right: its score (blue) among the synthetic markets; the dashed line is the 95th percentile it must beat. Not cleared. All four findings
Four popular signals, none cleared
NASDAQ Composite, daily, since January 2015. “Swing” is the largest shift in the odds of a move; “matched by chance” is how often synthetic markets score at least as high.
| Condition | Swing | Matched by chance | Result |
|---|---|---|---|
| Golden cross (50-day about 10% above the 200-day) | 24.5 pts | 8.4% | Not cleared |
| Price 4% to 6% above its 200-day average | 27.4 pts | 23.2% | Not cleared |
| 10-year Treasury yield below 1.34% | 42 pts | 7.6% | Not cleared |
| 10-year Treasury yield 2.5% to 2.9% | 21.2 pts | 40.7% | Not cleared |
Five stages, each written to disk
Each condition gets split into ranges (“bins”) and each bin goes through five stages. Selection consumes only a current validation result, and the forecast only a current selection.
| Stage | Command | What it does |
|---|---|---|
| 1. Measure | measure | For each bin, the probability that the market moves by a given percentage within a given number of days. |
| 2. Compare | compare | Subtract the unconditional market baseline, leaving the shift the condition is associated with. |
| 3. Validate | validate | Score the shift and repeat the whole measurement on 1,000 synthetic markets. The bin clears if fewer than 5% of them score as high. |
| 4. Select | select | Keep every bin that cleared, ranked by evidence, with adjusted values for how many would clear by chance. |
| 5. Forecast | forecast | Combine the kept conditions active on the latest bar, and compare with their historical joint rate. |
What clearing does and does not mean
- A memoryless null
- Synthetic days are drawn independently, so the null has no volatility clustering or regimes. Clearing means a condition beats a market without memory — a test it has to pass, not proof of an edge you can use.
- Many tests
- A bin clears at a raw p-value below 0.05, without multiple-testing correction. Benjamini–Hochberg adjusted values are reported for context; when lots of bins are tested, some will clear by chance.
- Scope
- Findings hold for the data and period of the workspace that produced them. AlphaVerify is research software, not investment advice.
The method states every limitation in full.
Install and run a workspace
You’ll need PyTorch, and a CUDA-capable GPU is strongly recommended. Three workspaces ship with the package: NASDAQ daily, bitcoin daily and bitcoin hourly.
python -m pip install alphaverify

alphaverify init --workspace nasdaq_daily
alphaverify measure
alphaverify compare
alphaverify validate
alphaverify select
alphaverify forecast
After validate, the figure for every tested bin is written to workspaces/nasdaq_daily/03_validation/plot/.