
Research on how markets behave under stress
DoubleTrends L.L.C. is a quantitative research firm. We study market regimes, drawdowns and how investors behave in them, put our methods and records out in full, and take on outside quantitative research and data engineering work.
Research, validation, and a public indicator
Research
Notes on S&P 500 drawdowns, investor behavior and the measures behind market regimes — plain language, the data on the page, the limits spelled out.
Validation
AlphaVerify, open-source software that checks whether a trading signal’s edge holds up next to markets with no signal in them. The full mathematical specification is published with it.
The Regime Indicator
A rules-based daily read of S&P 500 stress going back to December 1995, published along with its methodology and every signal it has given.
AlphaVerify: does a signal beat chance?
An open-source framework that pits a trading signal’s apparent edge against 1,000 synthetic markets with no signal in them. Popular conditions often lose: on the NASDAQ since 2015, the golden cross shows a 24.5-point swing in the odds — yet signal-free markets turn up one at least as strong 8.4% of the time.
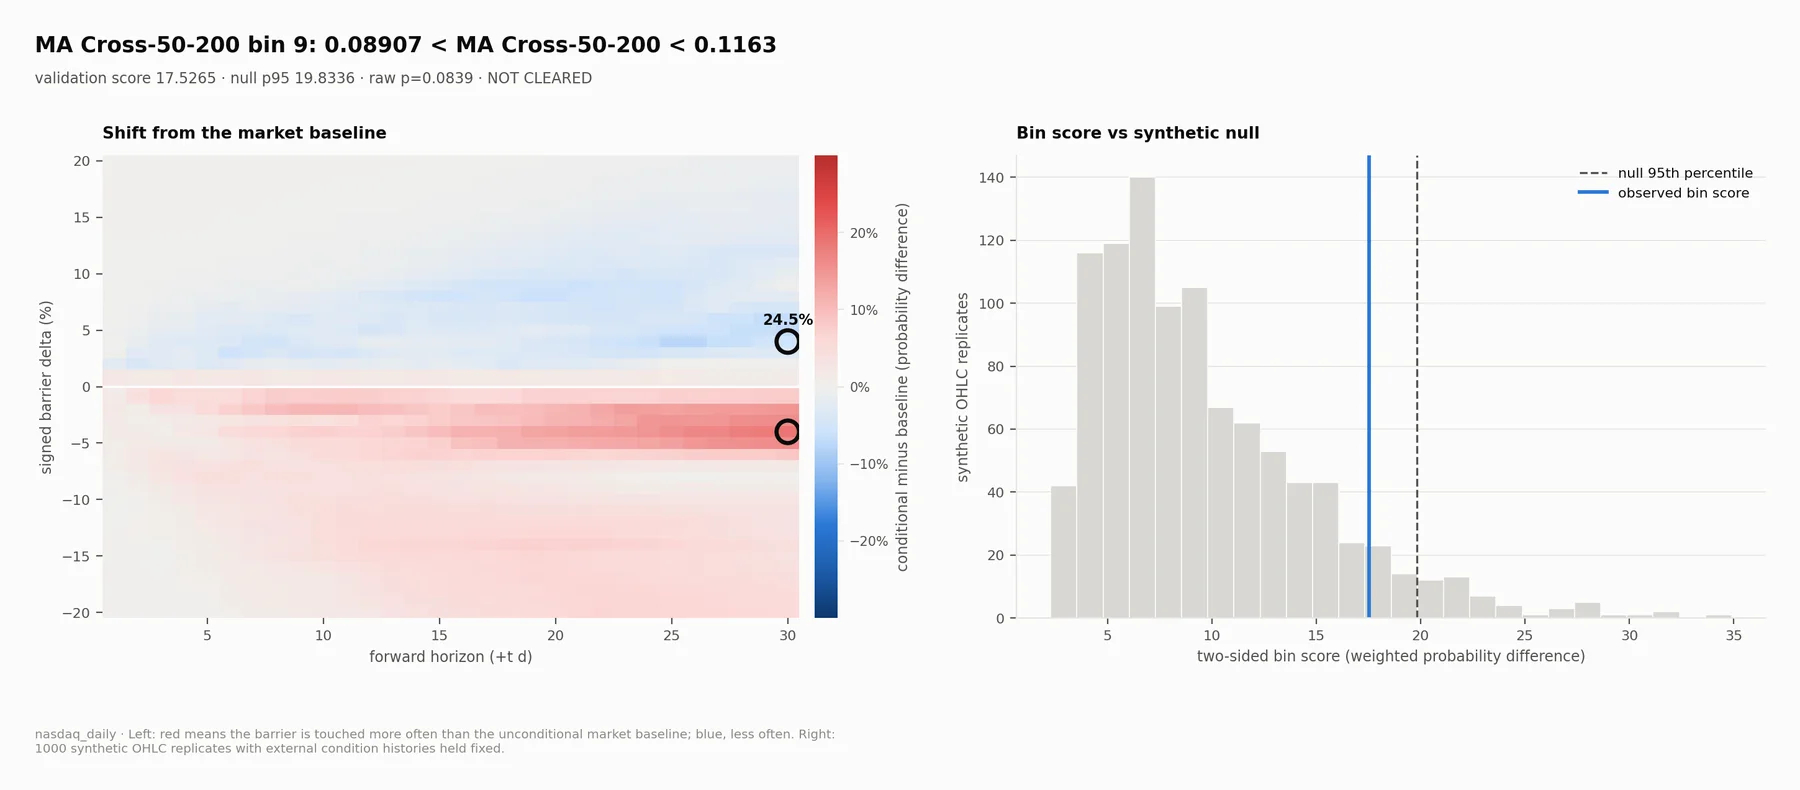
Left: shift in the odds of each move while the condition holds. Right: its score (blue) against the synthetic markets; the dashed line is the 95th percentile it must beat. Not cleared.
Recent research notes
-
June 6, 2026
Macro inputs · Inflation
CPI Inflation and Federal Reserve Pressure
Why year-over-year CPI matters as context for Federal Reserve policy, and how high inflation combined with active tightening enters the bear-regime overlay.
-
May 25, 2026
Studies · Market history
S&P 500 Drawdowns Since 1950: How Often Corrections and Bear Markets Happen
How often the S&P 500 falls 5%, 10%, 20% and 30% since 1950, how long recovery usually takes, and what those base rates mean for buying the dip.
-
January 12, 2026
Studies · Investor behavior
Why Buying the Dip Is Hard: The Best Days Happen During Crashes
Why buying the dip feels hardest when expected returns improve: the S&P 500's best days cluster inside crashes, and missing a few of them changes long-run results.
Standards a reader can check
The firm’s commitments are written down and every one of them can be checked on this site.
- Methods are published
- How each rule in the indicator is built is laid out in its methodology.
- Records are complete
- Every signal since Aug 1998 is listed with what came after it, early ones included. Back-tested history is labelled that way.
- How we are paid
- Subscriptions are priced near what the daily reading costs us to run, research services are billed per engagement. We accept no payments from brokers or exchanges. Details