The engine: Williams %R, doubled.
DoubleTrends™ works in three layers: a dual-timeframe Williams %R reversal, a market-regime classifier, and a confirmation gate. Williams %R is the engine underneath that stack: a momentum oscillator developed in the 1970s that measures where the current close sits inside the recent high-low range.
Why two timeframes, not one.
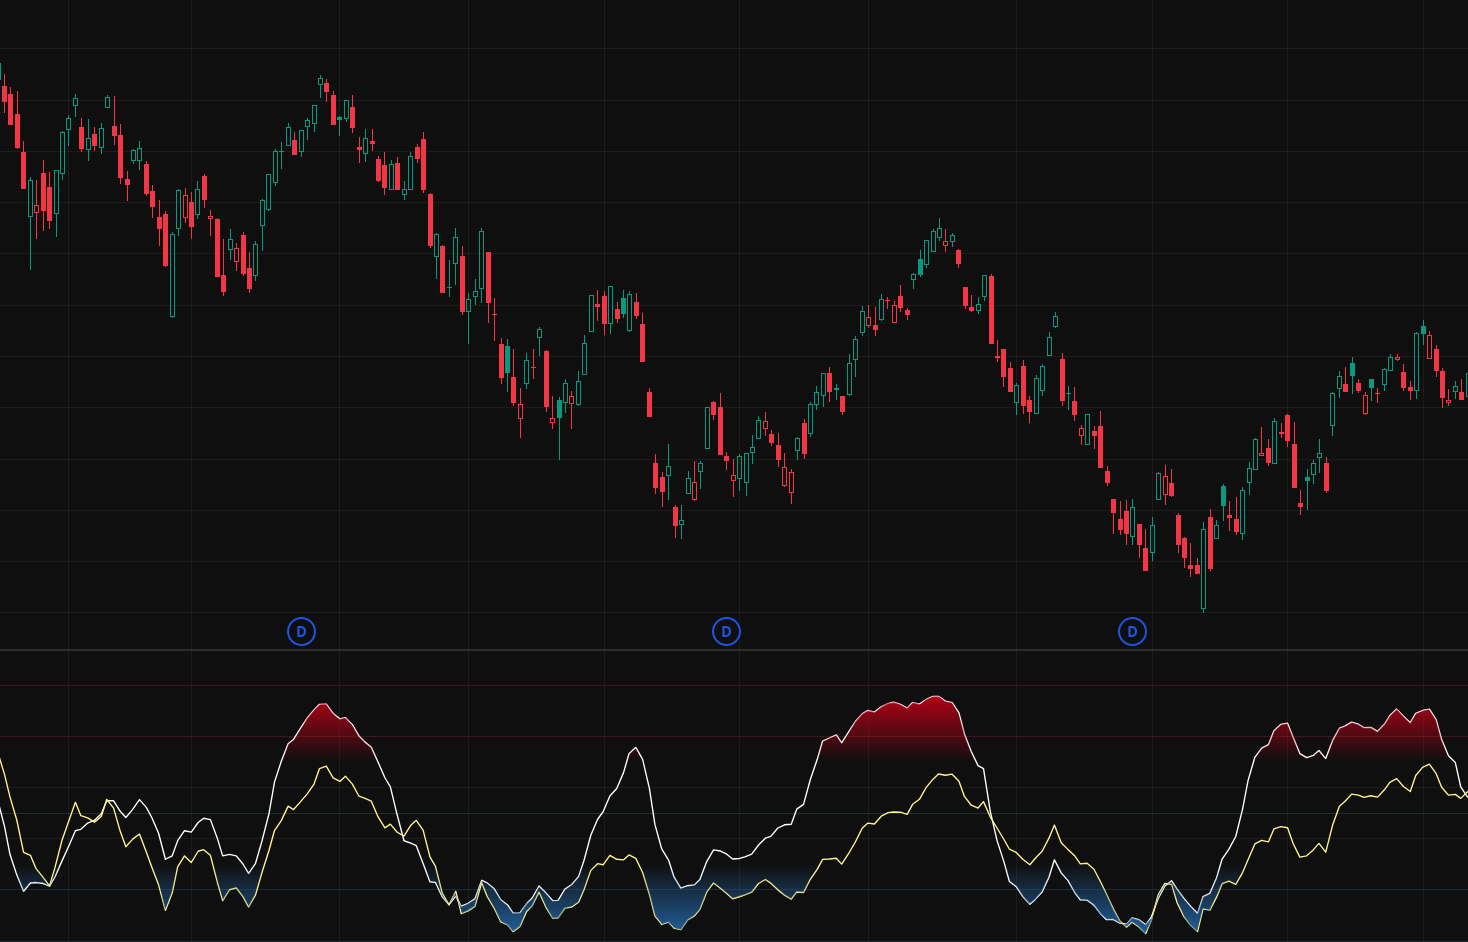
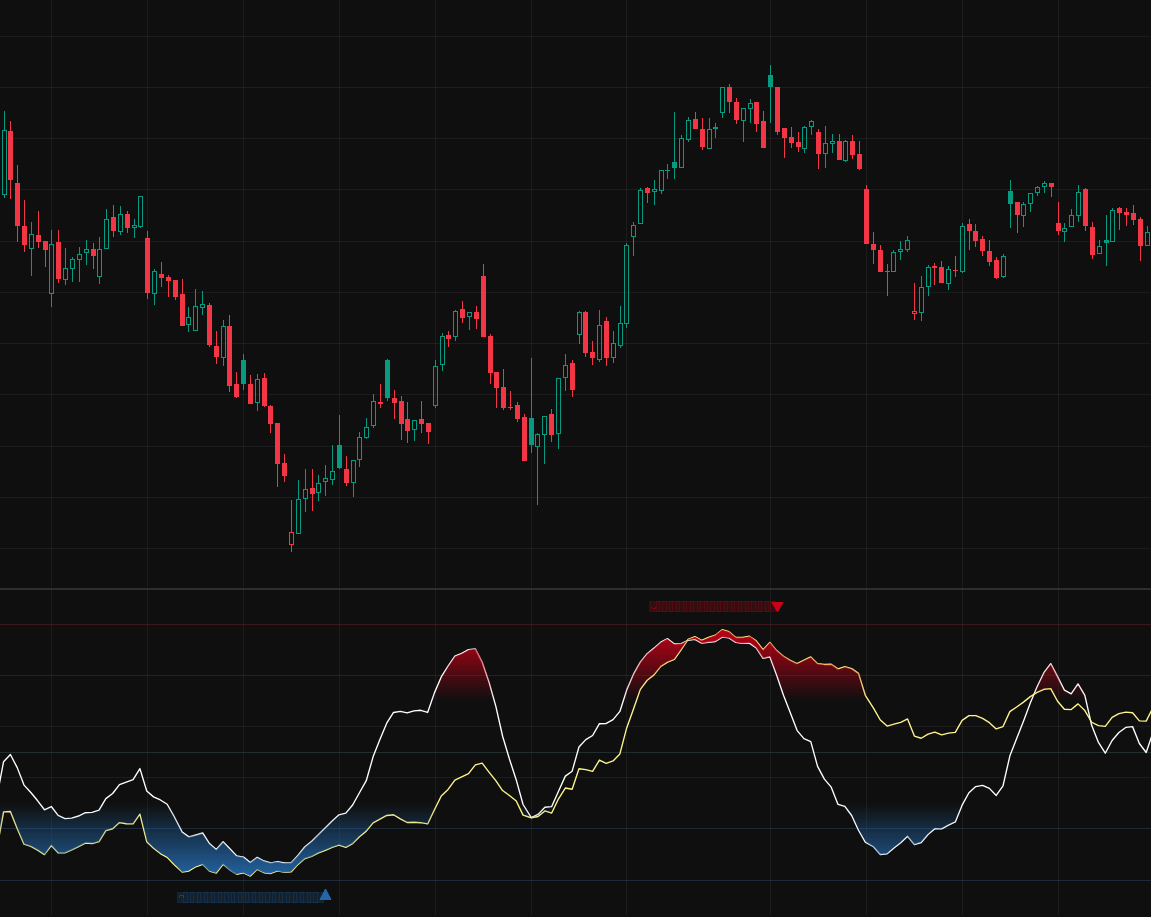
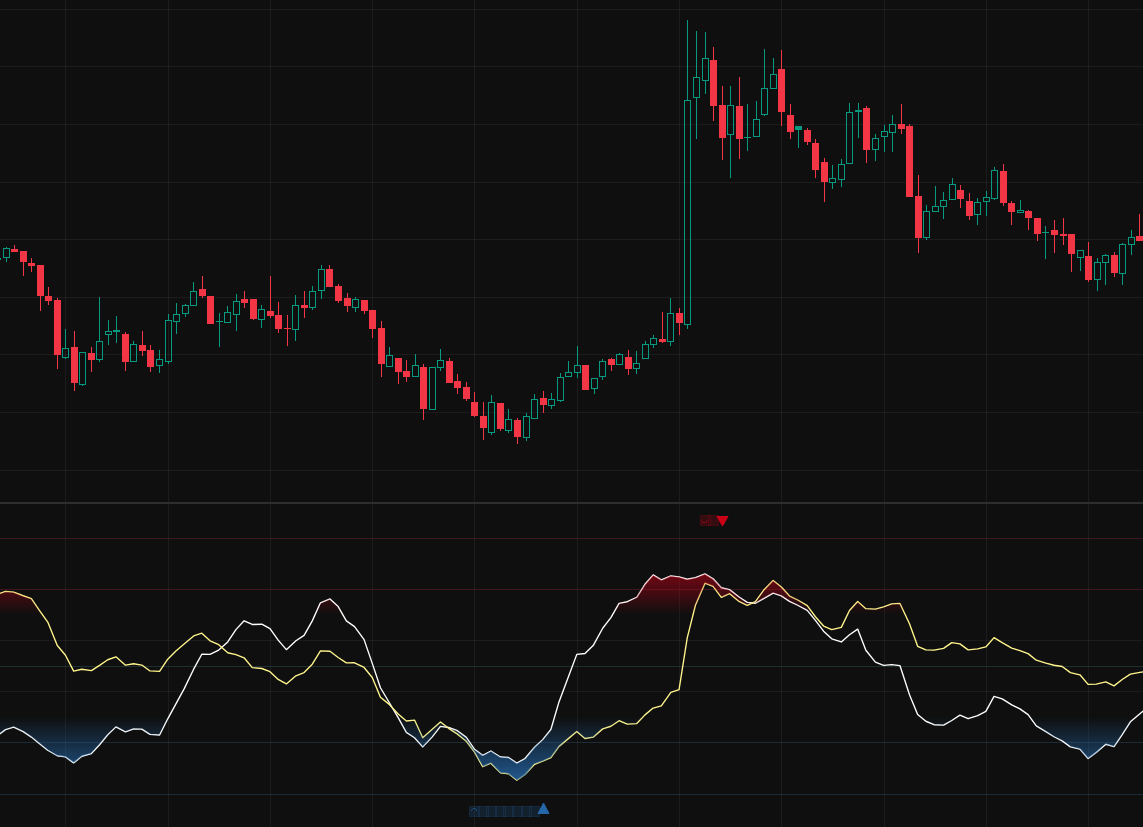
A single-period oscillator is too noisy. A short window catches every dip, including ones that don’t matter; a long window catches the deep ones but lags badly. So we run Williams %R on two timeframes at once — one short, one long — and smooth each to take out day-to-day chop.
A reversal candidate exists only when both timeframes agree the market is deeply oversold, and both start turning back up. The name DoubleTrends™ refers to exactly this: two trend signals, both pointing the same way.
A momentum oscillator, alone, doesn’t make money.
Every trading day, millions of chart-watchers, in the US, Japan, China, and every other market with a screen — if not two or six screens — run RSI, MACD, Bollinger Bands, Fibonacci retracements, Elliott Waves, and whatever pattern they can fit into a screenshot. They post their setups. They explain their conviction. They claim, in earnest, to have figured it out.
If indicators alone were enough to call market bottoms, every one of them would be rich.
THEY. ARE. NOT.
They fail because indicators alone have no context. A Williams %R reversal in a calm market means nothing; the same reversal in a panic means everything. With nothing telling them which is which, they fire on every oversold reading they see. Most of those are just routine pullbacks that resolve themselves quickly — noise, not opportunity.
Derived features: the shape of the selloff.
Price gives you more than just “up” or “down.” A few derivatives computed off the raw OHLC history describe what a selloff is actually doing — not just where it ended up. A 3% dip and a 25% rout look identical in the headline but represent very different markets.
Drawdown depth
How far below the trailing one-year high. The magnitude of the move. Tells you how bad it currently is.
Drawdown duration
How many bars since the last one-year high. A market that has been bleeding for six months is structurally different from one bleeding for two weeks — even at identical depth. Tells you how persistent it is.
Recent sharpness
The worst ten-day stretch within the trailing month. Captures sudden-onset stress: the kind of acute drop that happens in a panic, not a grind.
Reference high
Where the recent ceiling sat. Gives the rest of the rule something to be relative to — current price loses meaning without a benchmark.
Together, these let the rule distinguish “down 3% over six weeks” (mild) from “down 15% over four weeks” (acute) — even though both end at similar drawdown levels.
External anchoring: the world around the price.
Price is necessary but not sufficient. A 10% drop with low volatility and an accommodative Fed is a different market from a 10% drop with VIX spiking and the Fed tightening. So we anchor the rule to four external series that describe the macro environment around the price action.
VIX — volatility
The options market’s implied-volatility index. When VIX sits in the upper end of its trailing one-year distribution, the market is paying up for fear. We track VIX as a smoothed percentile rather than a raw level — where it sits in its own distribution matters more than the number.
Fed funds rate
The Federal Reserve’s policy rate, tracked as recent change over multiple horizons. Reads whether monetary policy is tightening, loosening, or holding — and how aggressively.
Unemployment
The U.S. unemployment rate, tracked both as recent change and against its trailing one-year average. Unemployment turning higher is one of the cleanest signals that the macro regime is deteriorating.
CPI inflation
Year-over-year inflation. Gives the context for what the Fed is reacting to — a Fed tightening into low inflation is a different beast from a Fed tightening into 5%-plus inflation.
These four anchor the price-based features to the real world. Together with the derived features above, they feed the regime classifier.
Not every selloff is the same.
Most of the time, the market is doing nothing interesting. On most red days the selling is mechanical: pension rebalancing, retirement-account withdrawals, monthly DCA flows from people who need the cash. Boring. Reverting. Trying to time a Williams %R bottom in that kind of market is just noise-trading.
Then, occasionally, something else happens. Acute selling. Forced de-risking. Volatility spiking. The macro picture deteriorating. That is the environment where buy-the-dip has historically paid — and where waiting for a Williams %R reversal is actually doing work. The rule needs to know which environment it is in. So we classify.
| Regime | Character | Signal eligible? |
|---|---|---|
| 🟢 calm | low stress, near highs | no — selloffs are noise |
| 🟡 correction | off the highs, contained | no — benign pullbacks |
| 🟠 panic | acute drop + vol spike | yes — this is the asymmetry |
| 🔴 bear | chronic, prolonged, macro stress | yes — filtered hard |
Bear deserves a note. Bear markets have the deepest selloffs, but they also have the most fake bottoms — the V-bounces that look like recovery and then resume falling. So while bear-regime reversals can fire, they have to clear a harder confirmation bar than panic-regime reversals. The product is willing to wait.
When the signal actually fires.
A DoubleTrends™ signal only fires when all three gates agree on the same day.
First — the engine sees a reversal candidate. Both smoothed Williams %R timeframes have been deeply oversold and have started turning.
Second — the regime classifier reads panic or bear. If the market is in calm or correction, the reversal is dropped on the floor. No exceptions, no overrides.
Third — the reversal has to clear confirmation. Panic and bear both gate the trigger, but bear clears a harder bar — bear markets produce too many false bottoms to fire on the first oversold turn.
Both smoothed Williams %R timeframes oversold & turning up?
Regime = panic or bear?
Reversal confirmation cleared? Bear clears a harder bar than panic.
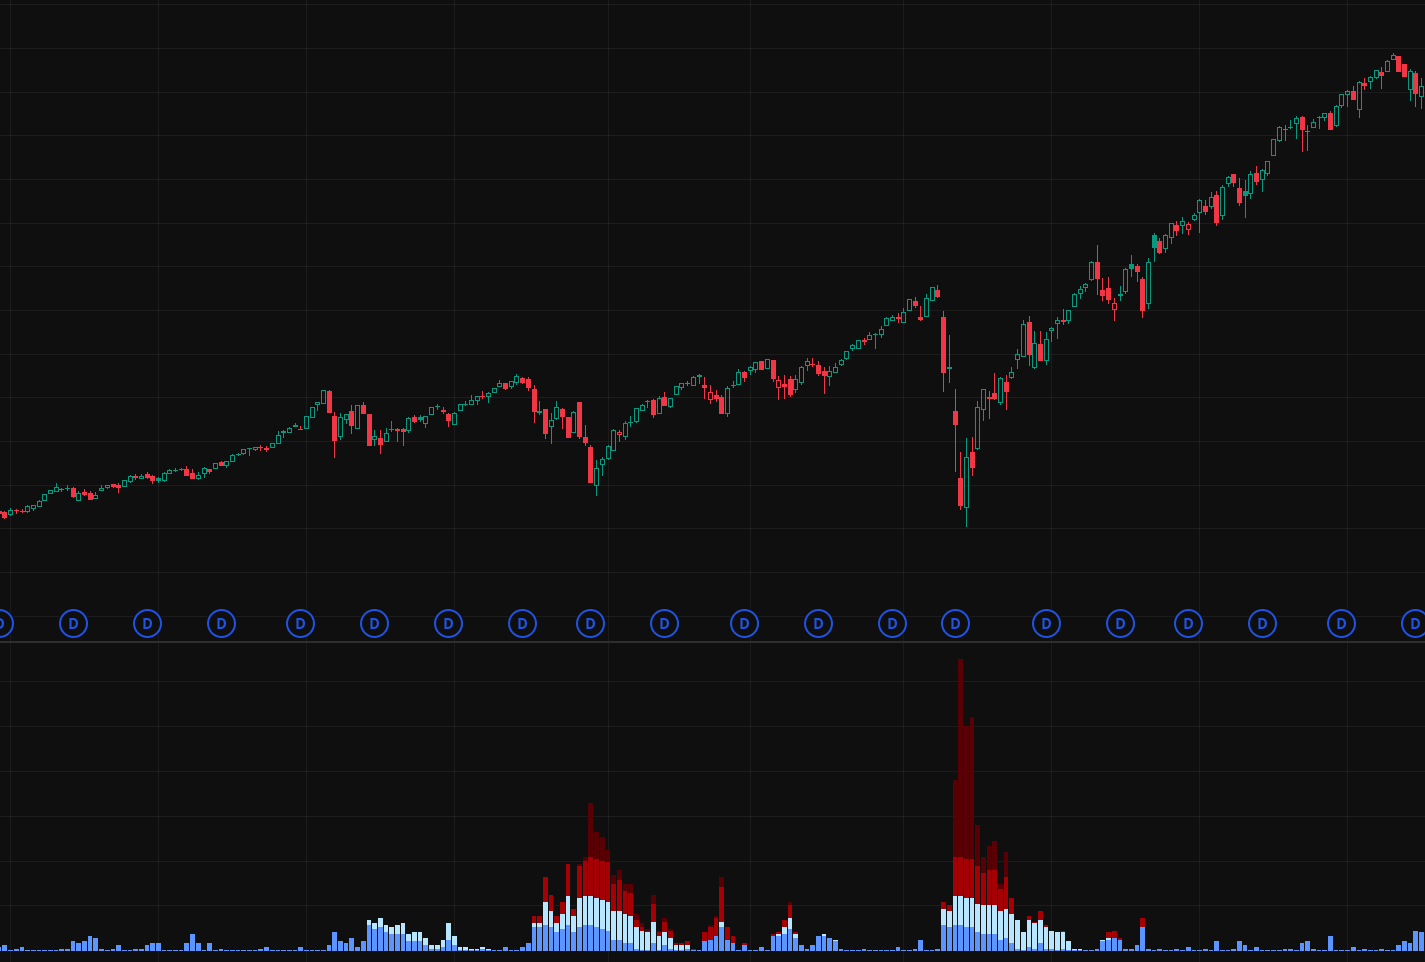
When all three line up, the signal fires for that trading day. By construction, signals are rare. Some years produce several; others produce none. That rarity is not a bug — it is the entire point of the design.
Point-in-time. No future leak.
On every historical date in the replay, the system sees only data that was available on that date. Today’s features cannot inform yesterday’s signal. This is how the track record on the home page stays honest: every signal is decided as it would have been decided live, on the day.
The live pipeline runs hourly through the trading session and locks the final signal at 16:10 America/New_York, after the cash market closes. Up until that lock, the day’s read is provisional. After it, the day’s signal state is frozen and stored.
Causality is not a feature layered on at the end. It is the constraint the rest of the rule was built inside of. Without it, the track record would mean nothing.
What we show. What we keep close.
The honest question after reading this far: but what are the exact thresholds? Where is the line between calm and correction? What VIX percentile trips the panic regime? How many bars of bear confirmation are required?
Here is the boundary, explicitly.
- · the five inputs (price, VIX, Fed funds, unemployment, CPI)
- · the four regimes (calm, correction, panic, bear)
- · the three signal gates and their order
- · the daily cadence and the EOD lock time
- · the point-in-time / no-leak discipline
- · the philosophy behind every gating choice
- · exact numerical thresholds
- · cutoff percentiles per input
- · drawdown depth / duration bands
- · bear-confirmation gate parameters
- · smoothing windows and lookback periods
- · cluster-gap rules and reset bands
The proof of the rule is not in the parameter values we could publish — it is in the track record you can already see. Every signal since 2004, every forward return, every miss. That is the audit.
Institutional-grade signal. Retail access.
The engine is built to institutional standards, but access is not reserved for institutions. The next page shows how a retail subscriber can use the bot directly, what gets delivered, and what the terms look like in practice.
Method → Product
From rule logic to live access.
TRY IT YOURSELF.