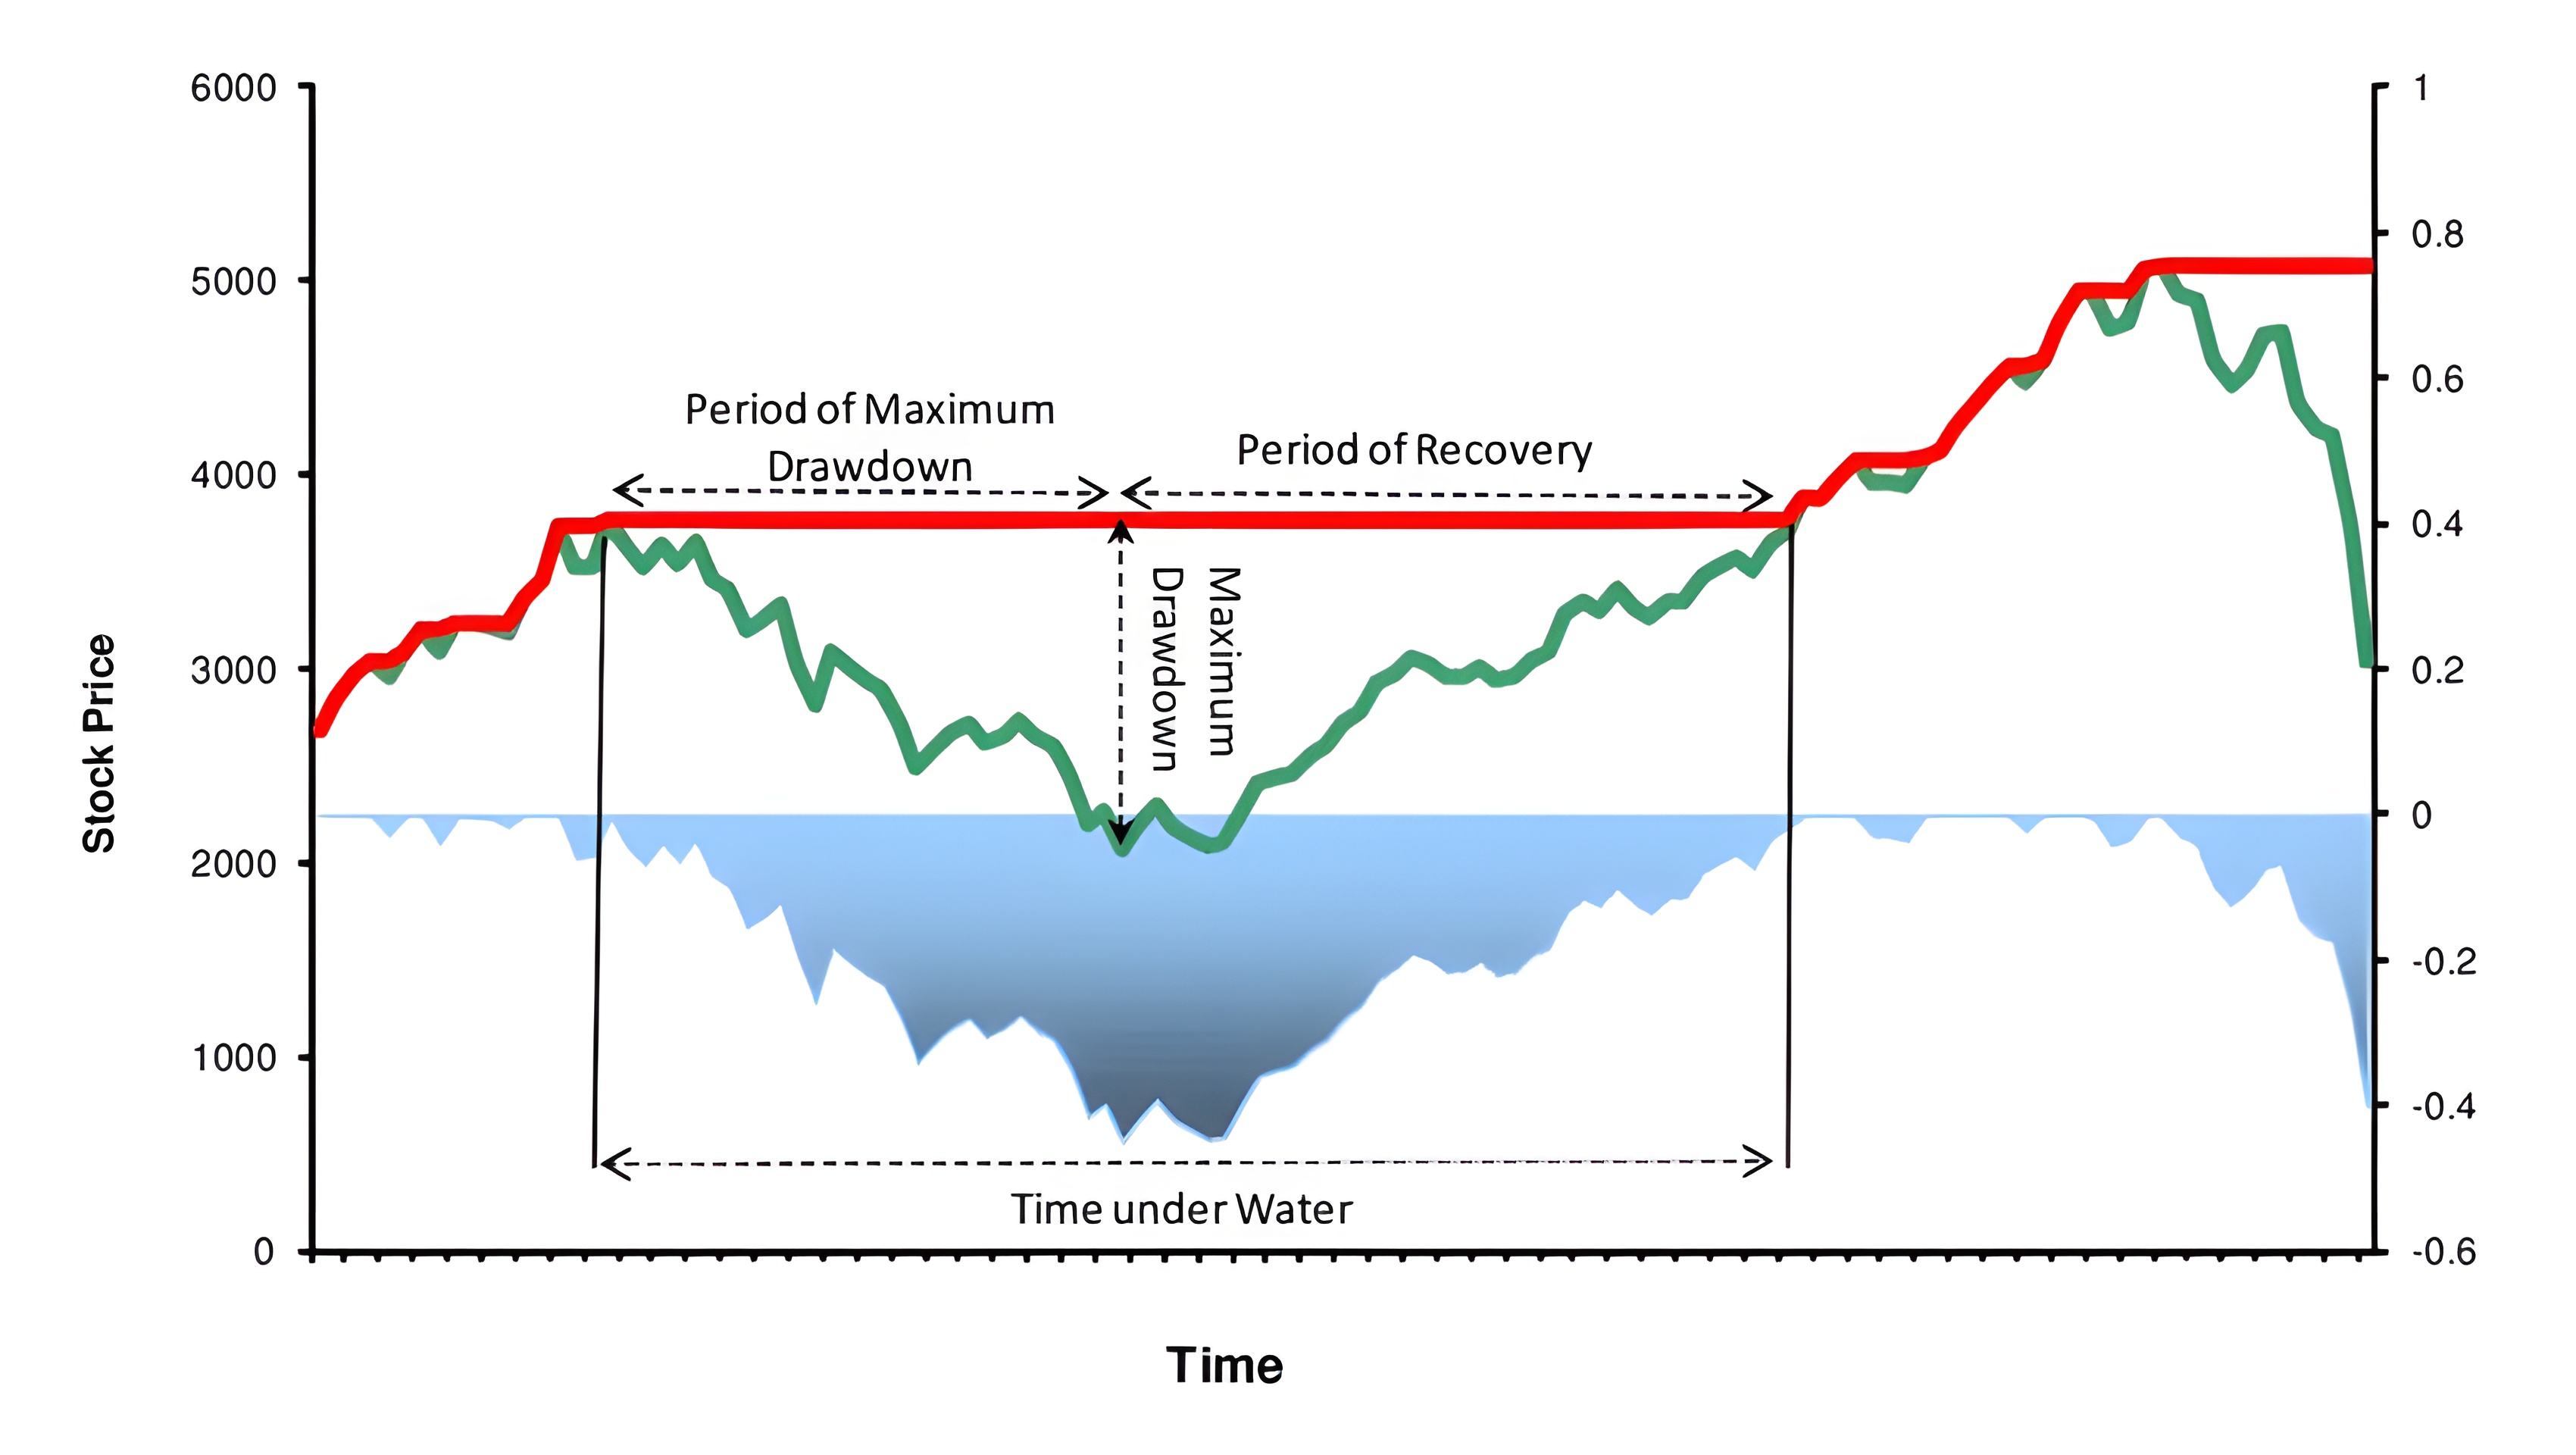
Maximum Drawdown
Maximum Drawdown is our own measure of how depressed price is versus its own history — a percentile lens that turns “how far have we fallen” into a layered, multi-timeframe read of market stress. It is useful context for dip research, but it is not the same thing as the DoubleTrends™ production alert.
Price, ranked against its own past
Instead of comparing price to a moving average, Maximum Drawdown asks a simpler question: across a lookback window, how many past closes sit above today's close? The more prior closes that are higher, the deeper today's price sits within its own recent history.
It runs that count across several windows at once — 208, 52, 30, and 14 bars — so a single reading blends long- and short-horizon weakness into one layered view. A high count across windows means price is deeply depressed relative to where it has recently traded: a percentile of an asset against itself, not against an arbitrary benchmark or a fixed percentage threshold.
Finding panic, not noise
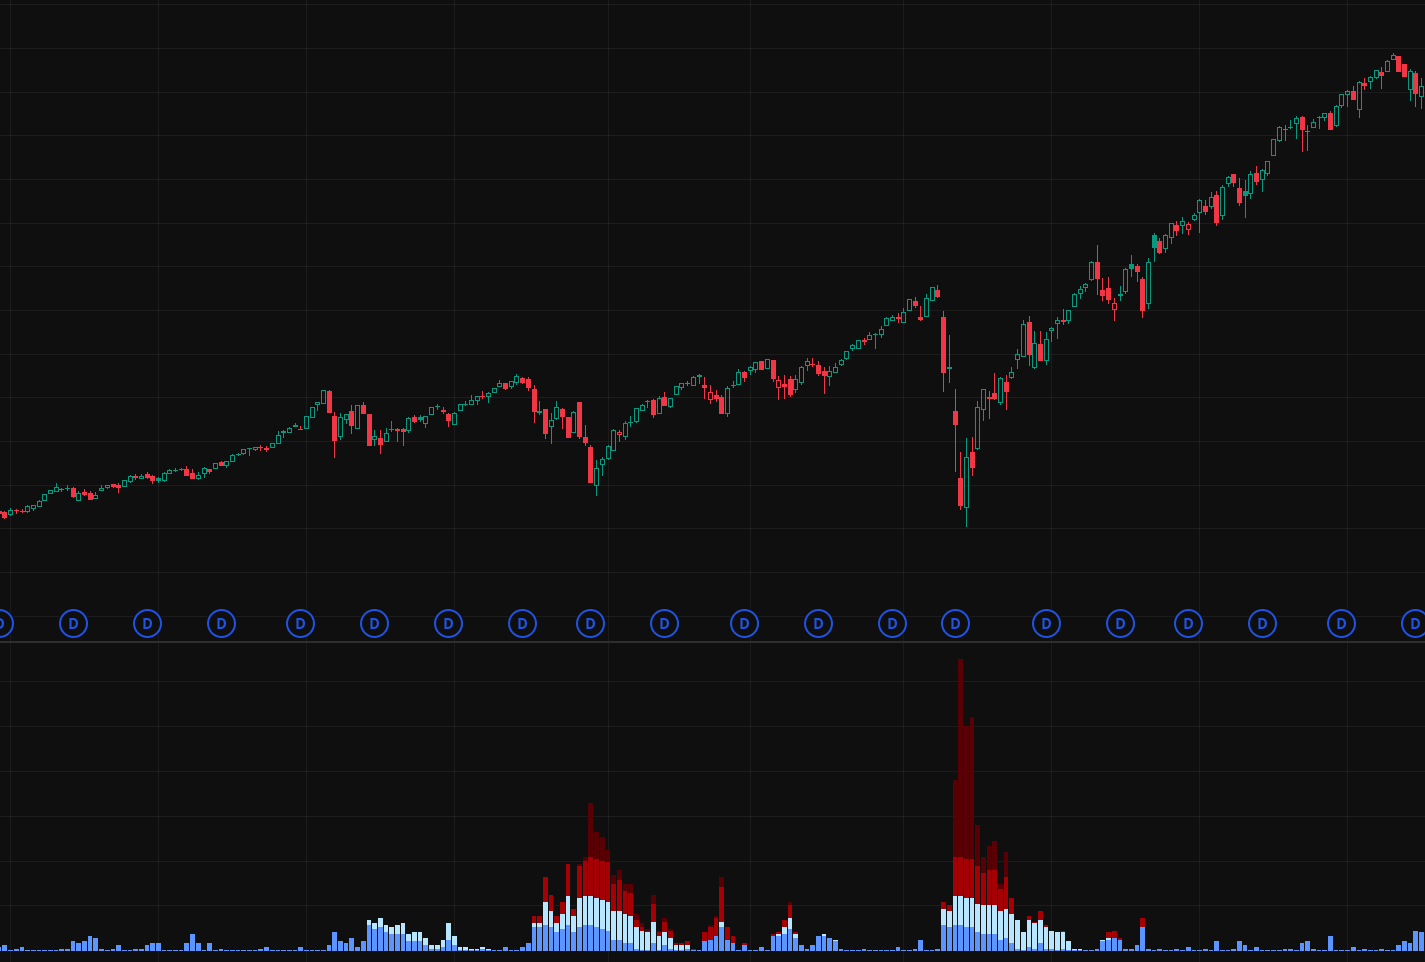
Extreme readings cluster where fear is doing the pricing — the moments a long-term investor wants to be buying, not selling. By measuring depth as a percentile of an asset's own history rather than a fixed percentage drop, the indicator flags undervaluation driven by capitulation, and adapts to each asset's own character.
It is meant to be read on both daily and weekly timeframes. The weekly view confirms that weakness is structural rather than a two- or three-day wobble, while the daily view shows how stress is building or easing right now. For a long-horizon investor, that distinction matters: small pullbacks are common, but layered stress across windows is rarer.
Thresholds and timeframes
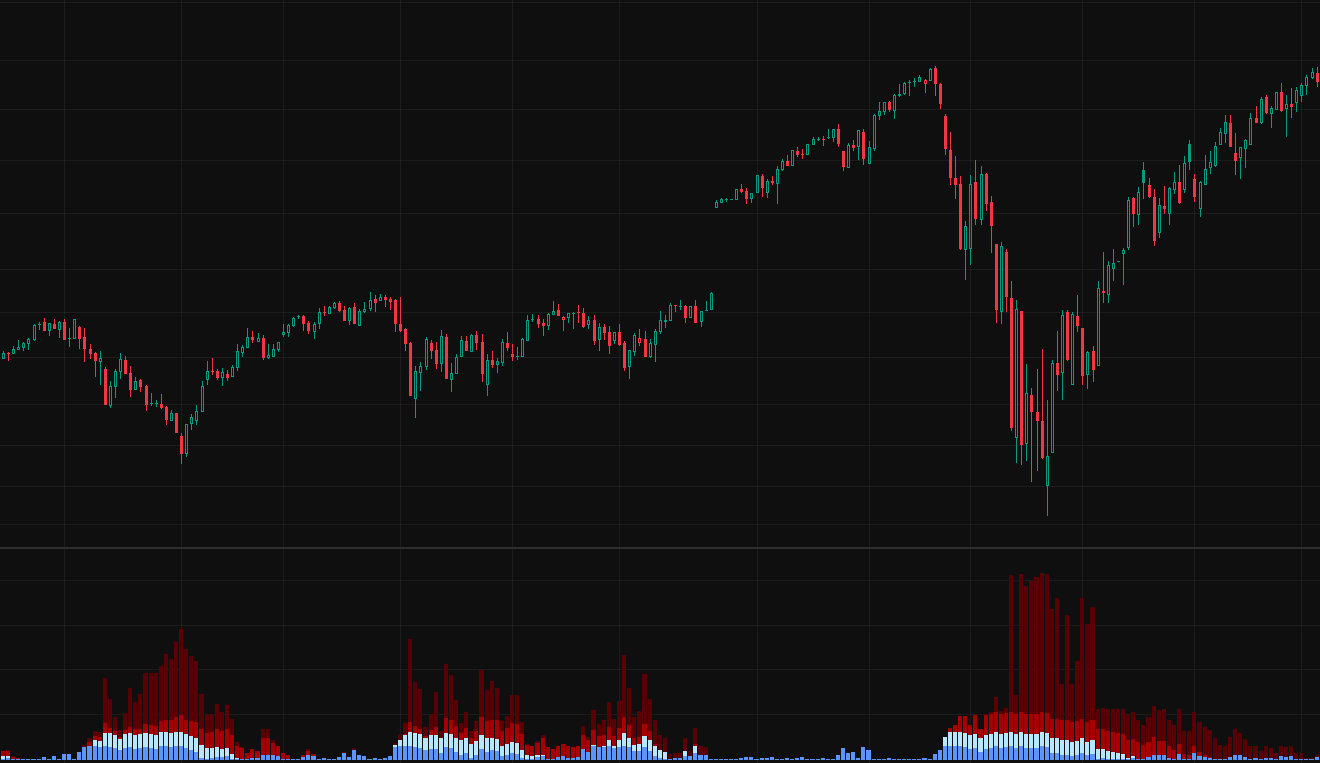
When the count crosses historically significant thresholds, price may be pricing in an unusually pessimistic scenario — the kind of condition long-term investors want to study carefully instead of ignoring. Deeper readings mean deeper stress; the rare, extreme ones are the layered all-timeframe lows that have lined up with major bottoms.
It is a context tool: it tells you how cheap, relative to history, not the exact day to act. DoubleTrends™ adds a different layer by waiting for oversold momentum to reverse. In practice, MDD frames the environment; the alert provides a dated rule event.
From “how cheap” to “now.”
Maximum Drawdown shows how depressed price is. DoubleTrends™ turns the dip thesis into a dated alert — one message when the S&P 500 index's oversold selling looks exhausted, for ETF investors using funds such as VOO, SPY, or IVV.
SubscribeMethod
Maximum Drawdown is original work by CDS: for each lookback (208 / 52 / 30 / 14 bars) it counts the past closes above the current close, then reads the layered result as a percentile of price within its own history. Educational information only — not financial, investment, or trading advice. Past performance does not guarantee future results.