Volume Profile & VWAP, Explained
Volume Profile and VWAP are two standard volume-based tools traders use to read where value and activity sit in the market. One maps volume across price levels; the other tracks the volume-weighted average price over a chosen period. They are not the DoubleTrends™ signal, but they help explain the market-structure language investors often see around support, resistance, and value.
Volume Traded at Each Price Level
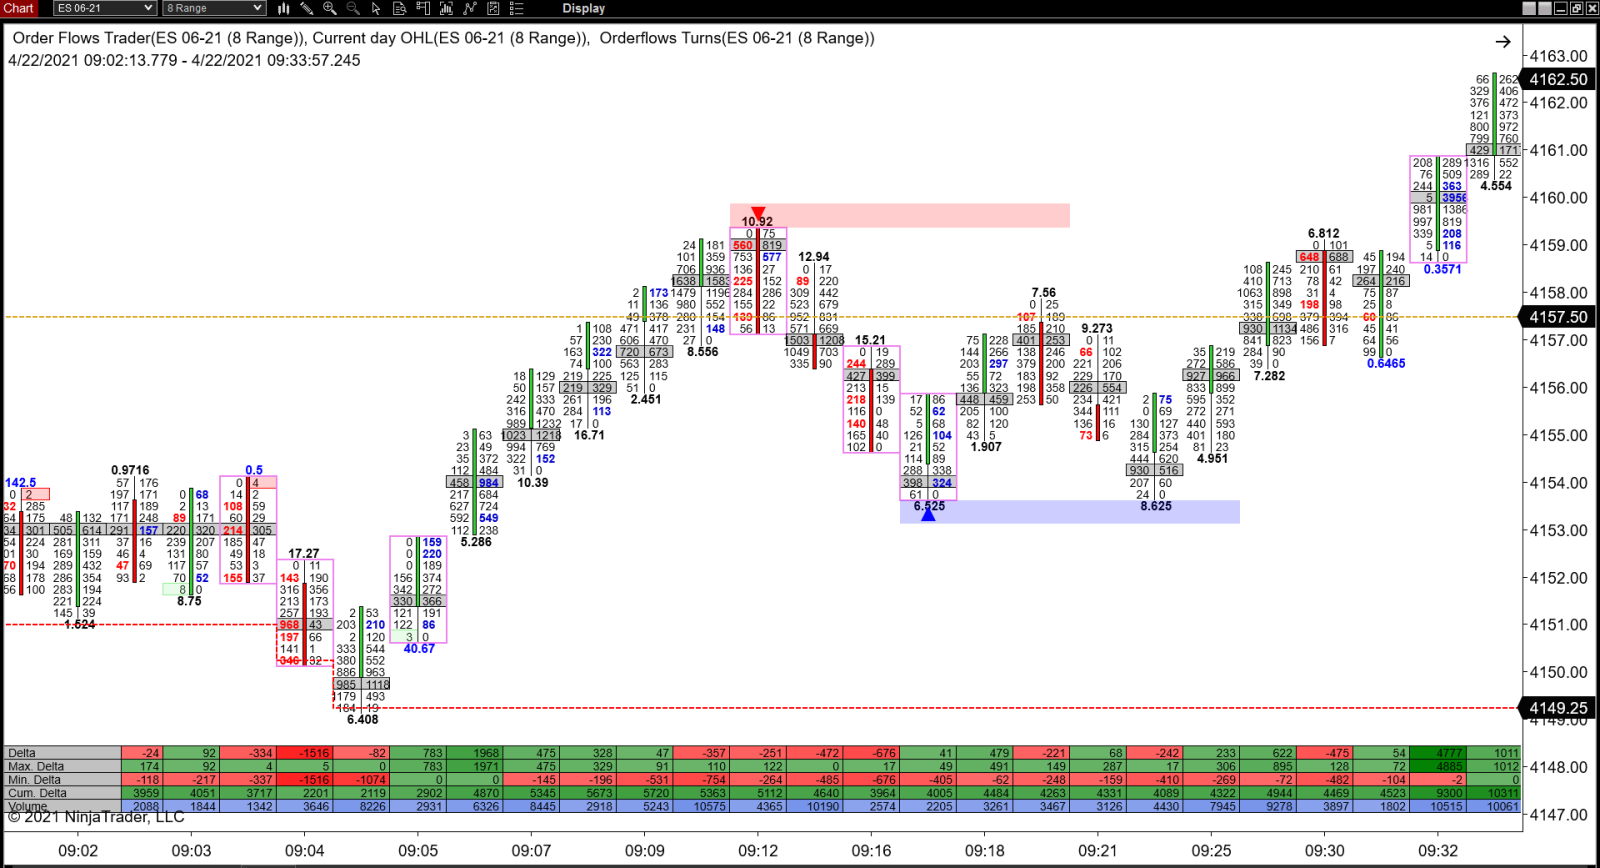
Volume Profile shows how much volume traded at each price level during a session or selected range. Instead of measuring volume only by time, it turns trading activity into a horizontal histogram alongside the chart, making it easier to see where the market spent the most time and did the most business.
High-volume nodes, often called HVNs, are price areas where trading activity was concentrated. These zones can act like areas of acceptance where price may pause, consolidate, or return. Low-volume nodes, or LVNs, are thinner areas where less activity took place; when price moves into them, it can sometimes travel quickly because there was less prior trading there. The tool does not tell you whether price must hold a level. It shows where prior participation was heavy or thin.
Volume-Weighted Average Price
VWAP is the average price of a security over a period, weighted by how much volume traded at each price. It is calculated by multiplying each trade price by its volume, adding those values over the chosen period, and dividing by total volume.
Because heavier-volume prices count more than lighter-volume prices, VWAP shows where trading activity has centered, not just the simple average of price. Traders commonly use it as an intraday benchmark: price above VWAP can suggest buyers are paying above the session's volume-weighted value, while price below VWAP can suggest the opposite.
Standard-deviation bands around VWAP show how far price has stretched from that benchmark, giving readers a simple way to compare current price action with the session's volume-weighted center. For intraday traders, that can frame whether price is extended. For longer-horizon ETF investors, it is mainly useful as background: a reminder that price is always being negotiated around where volume actually traded.
From market structure to a dated signal.
Volume Profile and VWAP help explain where activity and value sit on a chart. DoubleTrends™ turns a different question into an alert: when the S&P 500 index's oversold selling starts to reverse, for ETF investors using funds such as VOO, SPY, or IVV.
SubscribeEducational note
Volume Profile and VWAP are standard market-structure tools used by many traders and charting platforms. This primer is educational information only and is not financial, investment, or trading advice.