Volume Weighted Average Price (VWAP) Indicator
Volatility & Volume Analysis Series
VWAP is a lagging, volume-weighted indicator, used primarily for intraday trading to assess whether prices are above or below a fair value benchmark.
Institutional firms rely on VWAP to execute large orders (millions or billions in value). They break down orders into smaller pieces and use VWAP to ensure executions occur at a fair price without significantly impacting the market.
Used by: J.P. Morgan, Morgan Stanley, RBC Capital Market, Jane Street, BlackRock
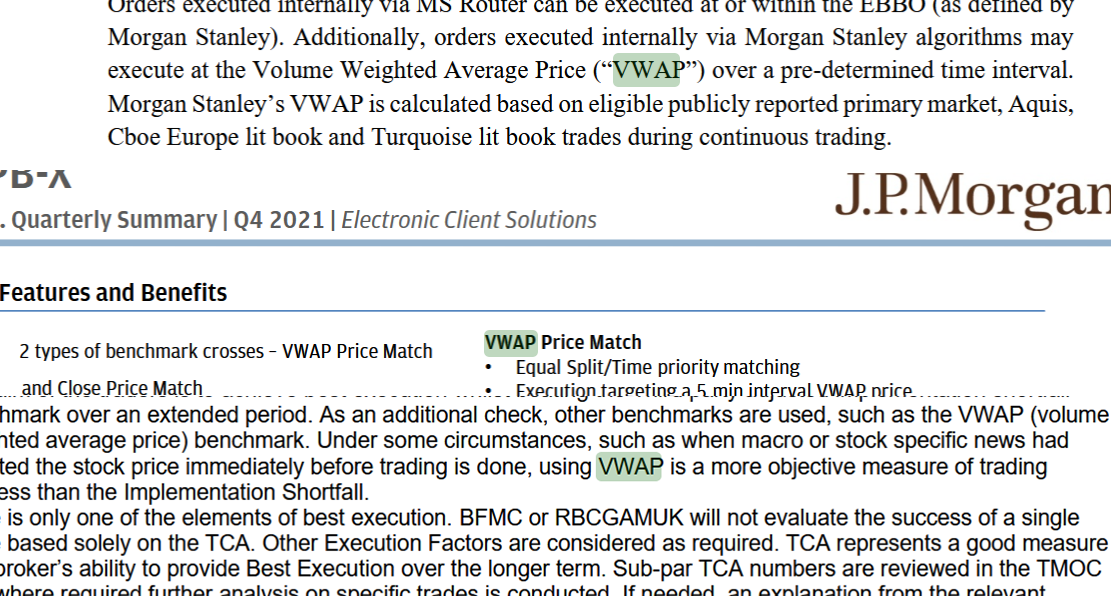
[1] J.P. Morgan U.S. Quarterly Summary
[2] Morgan Stanley Order Handling & Routing Practice
[3] RBC Capital Markets Aiden® Arrival Announcement
[4] ETF Execution Strategies — Jane Street
[5] BlackRock Global Perspective White Paper
The VWAP indicator plots the volume-weighted average price from the start of each trading session, giving traders a dynamic benchmark that adjusts with each trade. When price is above VWAP, the market is considered bullish; when below, bearish. Institutional algorithms commonly use this line as a trigger for order execution, making it a critical level for all market participants.