Double Trend Exhaustion™ Series
Reversal timing based on buyer and seller exhaustion
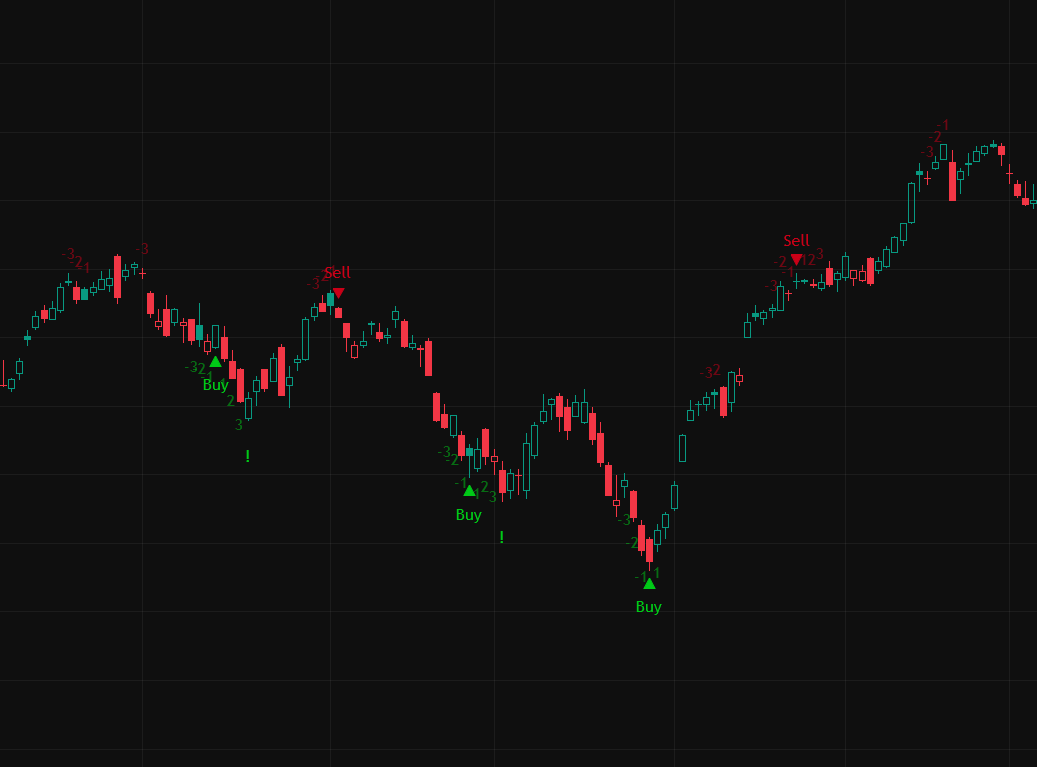
Inspired by the DeMark Sequential framework, DTE counts price bar progressions to identify
points where a trend is likely running out of momentum. When buyers or sellers are exhausted
— still pushing price but with declining volume support — the indicator marks a potential
reversal zone.
This is the free, open-source version. The full Pine Script source is available for download
so you can read the logic, audit the signal conditions, or adapt it to your own strategy.
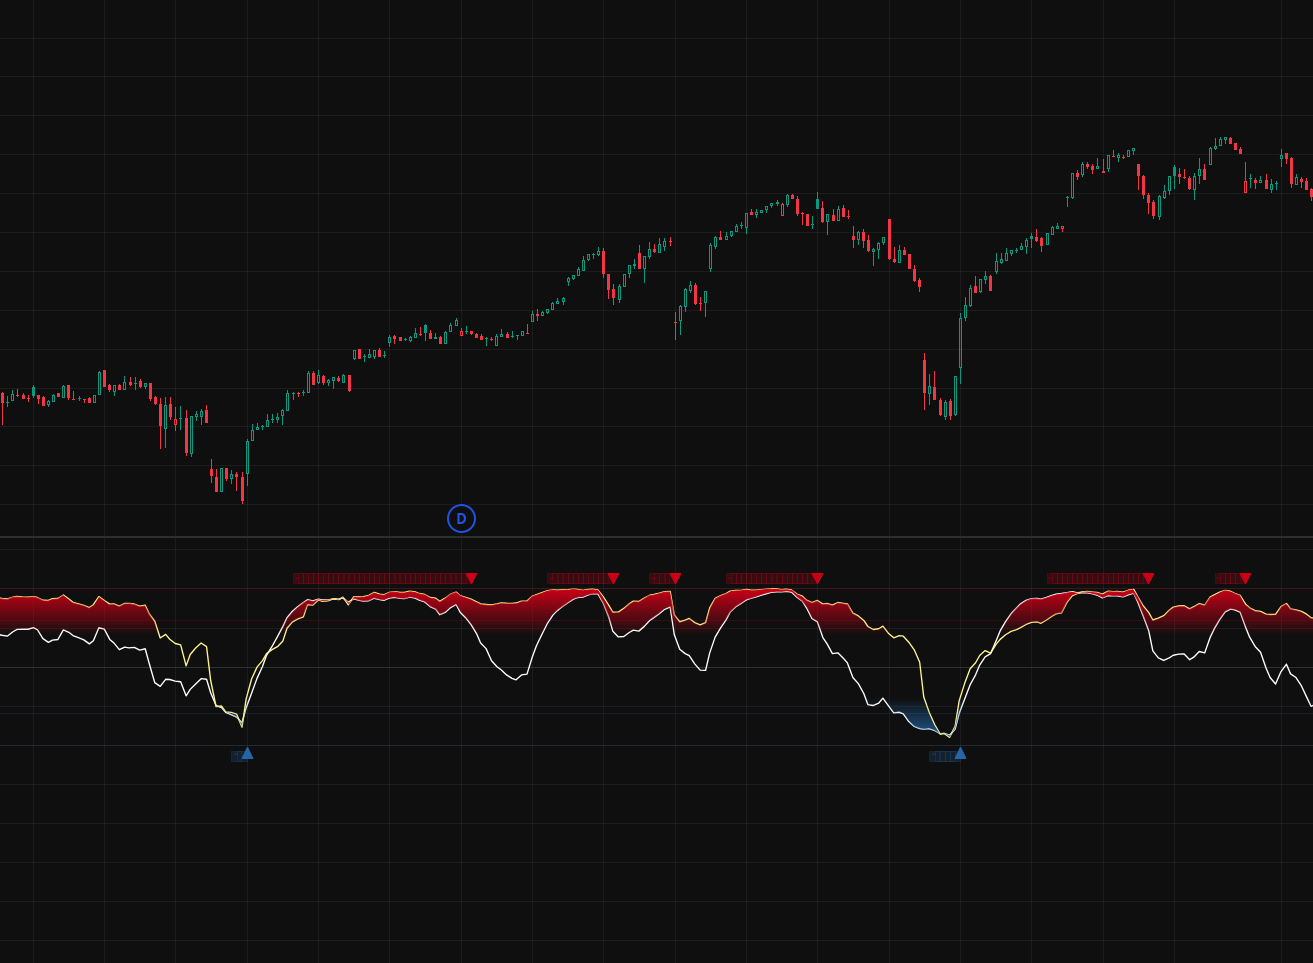
The Premium variant adds a Williams %R filter on top of the base exhaustion logic. Williams
%R is a momentum oscillator that measures where the current close sits relative to the
high-low range over a lookback period — when it diverges from price direction, it tends to
indicate a shift in momentum before it appears in price.
In practice, the filter reduces false signals in choppy or sideways markets. Fewer signals
overall, but a higher proportion close in the intended direction.
Volatility & Volume Analysis Series
Order flow and volume structure for active traders
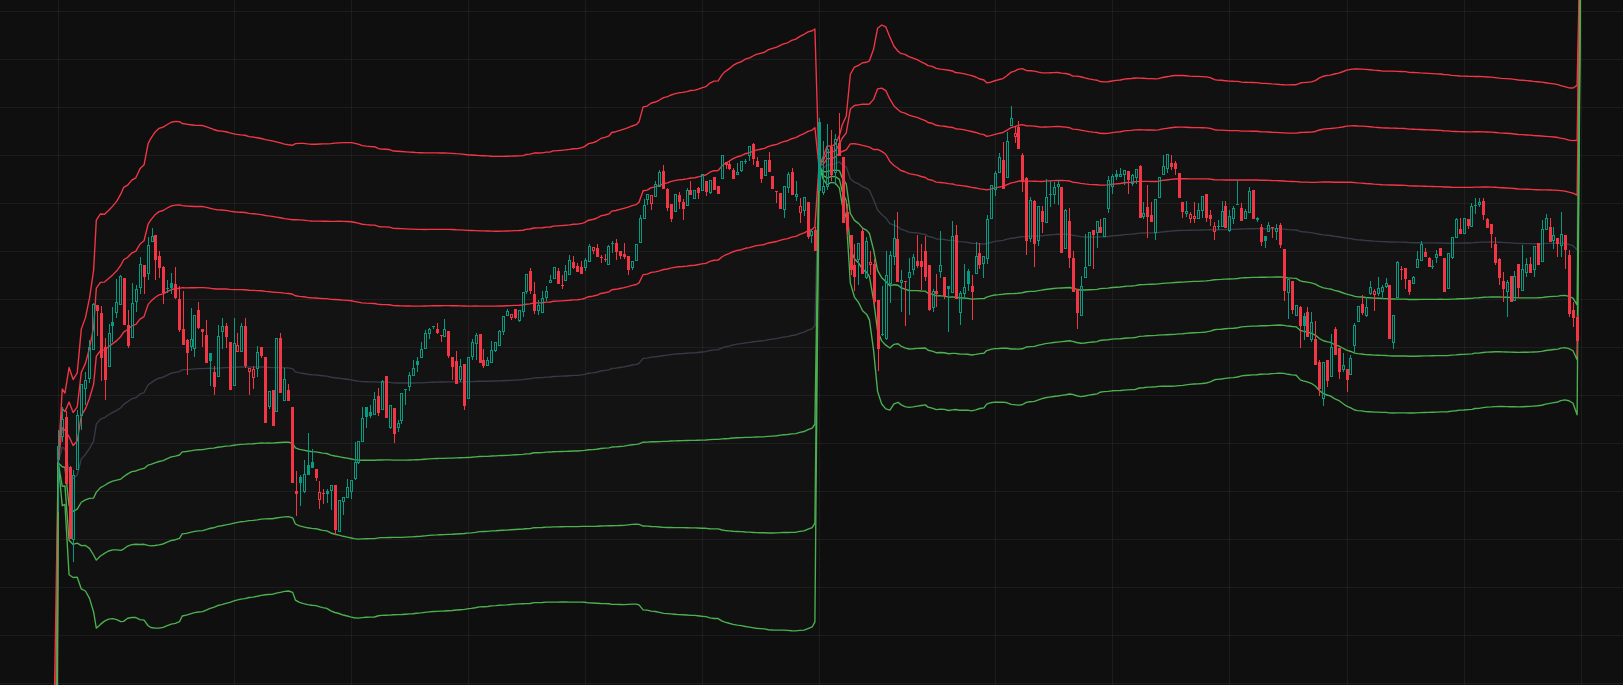
VWAP calculates the average price of an asset weighted by trading volume across a session.
It's widely used as a benchmark by traders executing large orders — price above VWAP
generally indicates bullish intraday sentiment; below suggests bearish.
This implementation is optimized for shorter timeframes and includes session-reset logic,
making it more useful for day trading and intraday setups than the default TradingView VWAP.
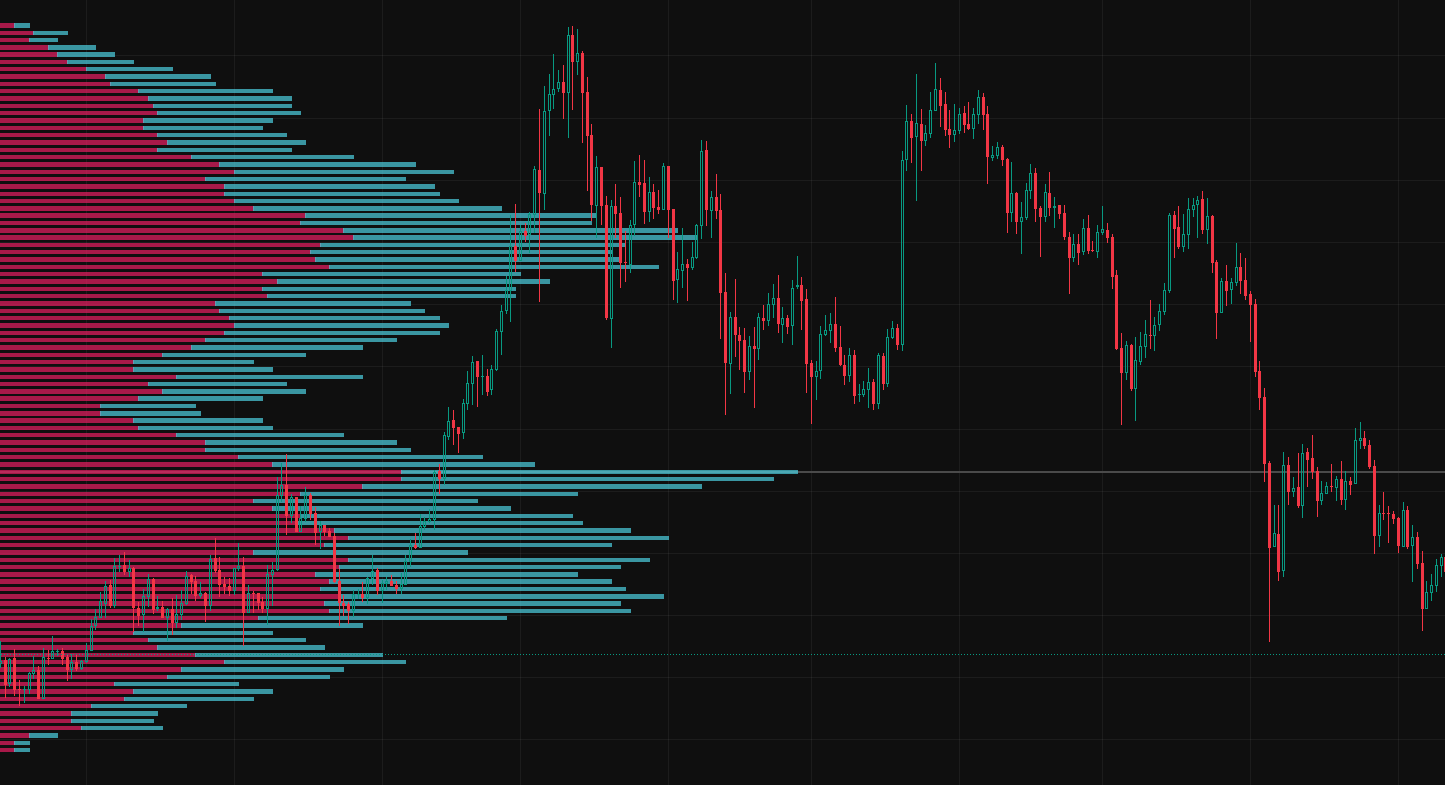
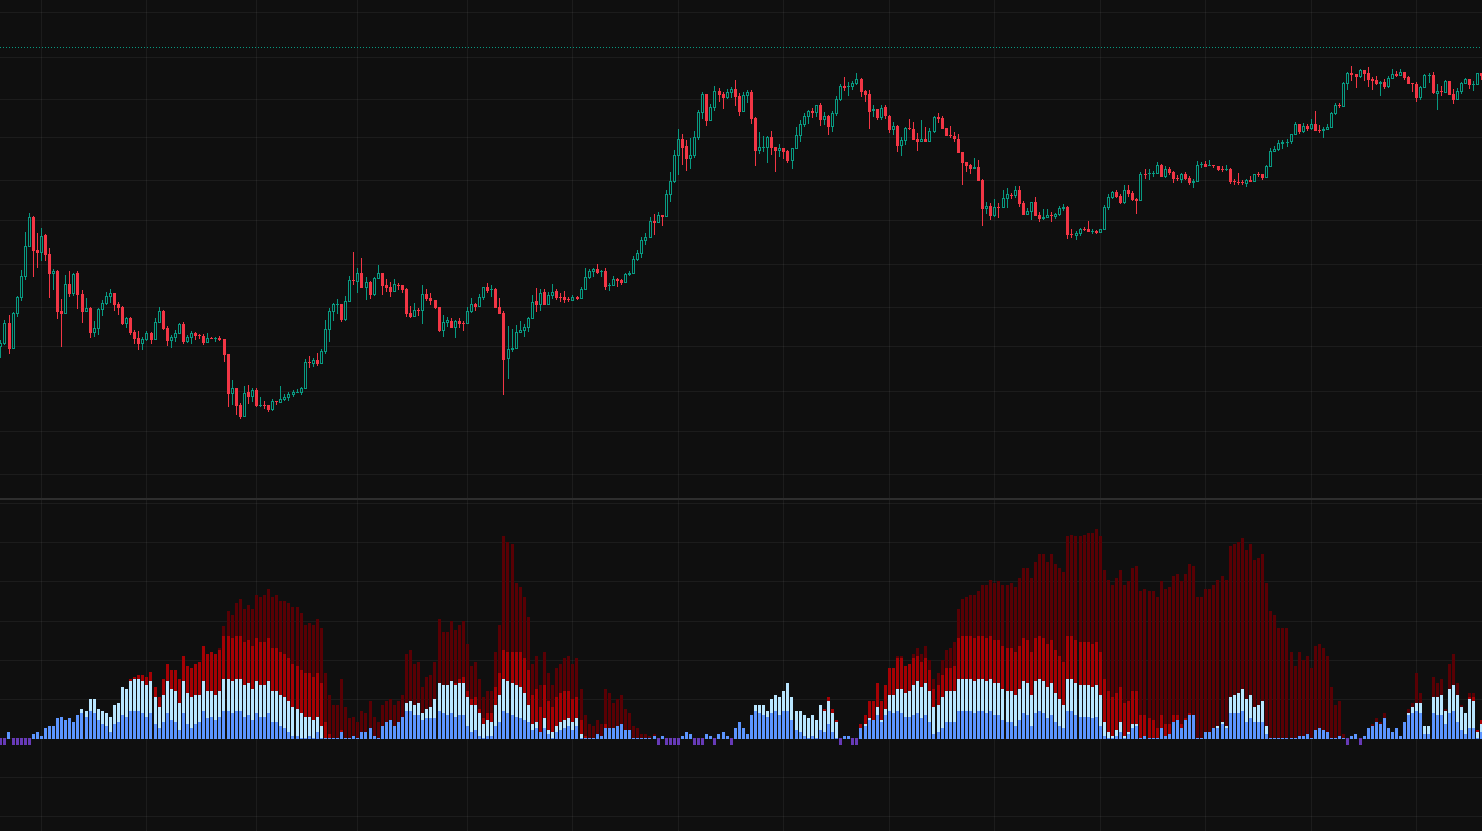
Volume Profile shows how much volume traded at each price level — not just over time.
The output is a histogram overlaid on the chart, revealing high-volume nodes (HVNs) where
price consolidated, and low-volume nodes (LVNs) where price moved quickly through.
HVNs tend to act as support or resistance on revisits. LVNs are areas where price can
accelerate when re-entered, with little structural resistance to slow it down.
Long-Term Entry-Exit Signal Series
Drawdown-based signals for position entries and exits
This indicator identifies when an asset's drawdown from its recent peak has reached a
historically significant threshold — conditions that have often, though not always,
marked durable lows worth entering. Similarly on the upside, it flags when price has
extended far enough above recent structure to warrant reducing exposure.
It's designed for longer holding periods where the goal is avoiding the worst entries
during panic selling and the worst exits during euphoria — not for timing short-term trades.