Double Trend Exhaustion™ Indicator
Double Trend Exhaustion™ Series
Double Trend Exhaustion™ is a momentum-based oscillator inspired by TD Sequential, best suited for long-term assets on daily or weekly timeframes.
It helps technical traders time market entry and exit points by identifying periods of trend exhaustion and potential reversals. By tracking shifts in intraday highs and lows, it offers early signals for short-term price action, making it a powerful tool for predicting market turning points.
Mostly used on: MQL5, QuantConnect
As momentum begins to build, a dynamic countdown -3, -2, -1 starts to appear, signaling
that the market is shifting. This early-stage indicator tracks sustained directional
pressure, and as the trend intensifies over nine consecutive periods, it reaches a critical
exhaustion point, ready to trigger a powerful reversal signal.
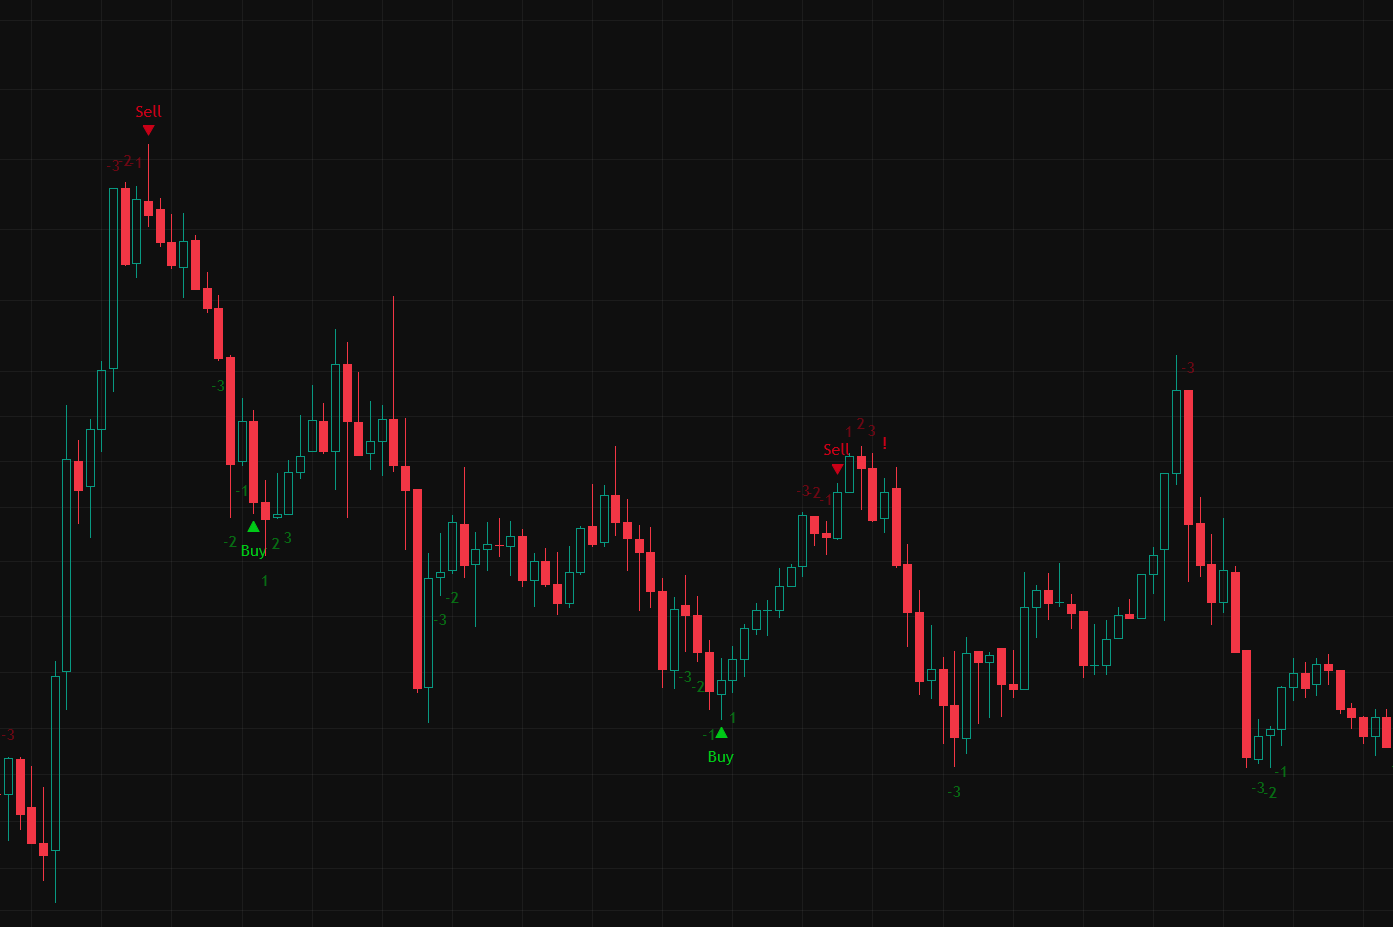
As shown in the graph, the -3, -2, -1 countdown progressively builds up, leading to a
signal trigger as momentum exhaustion is confirmed.
When a buy or sell signal is triggered, evaluate if the corresponding candlestick breaks
through the -3 and -2 levels. If it does, the setup aligns with optimal trend exhaustion
parameters, signaling a high-probability reversal. If not, the market may sustain its
directional momentum, indicating the possibility of continued trend progression before a
potential reversal.
As demonstrated in the graph, the second buy signal represents an optimal setup, where the
candlestick breaks through the -3 and -2 levels, confirming a high-probability reversal.
While the first buy signal is not optimal, since the candlestick did not break through the
-2 level.