Double Trend Exhaustion™ Premium Indicator
Double Trend Exhaustion™ Series
Double Trend Exhaustion™ Premium is a momentum-based oscillator inspired by Williams %R and serves as an upgraded version of the original Double Trend Exhaustion™.
By tracking shifts in 21-period and 112-period Williams %R, the indicator detects overbought and oversold conditions. EMA smoothing refines signals, reducing noise. Square markers warn of exhaustion, while a triangular signal confirms a potential reversal.
Williams %R — Fidelity Investments
https://www.fidelity.com/learning-center/...technical-indicator-guide/williams-r
Williams %R is a momentum oscillator that quantifies the relative position of the closing
price within the asset's recent high-low range. It is calculated by taking the difference
between the highest high over a defined period and the latest closing price, then dividing
this by the total range over that same period.
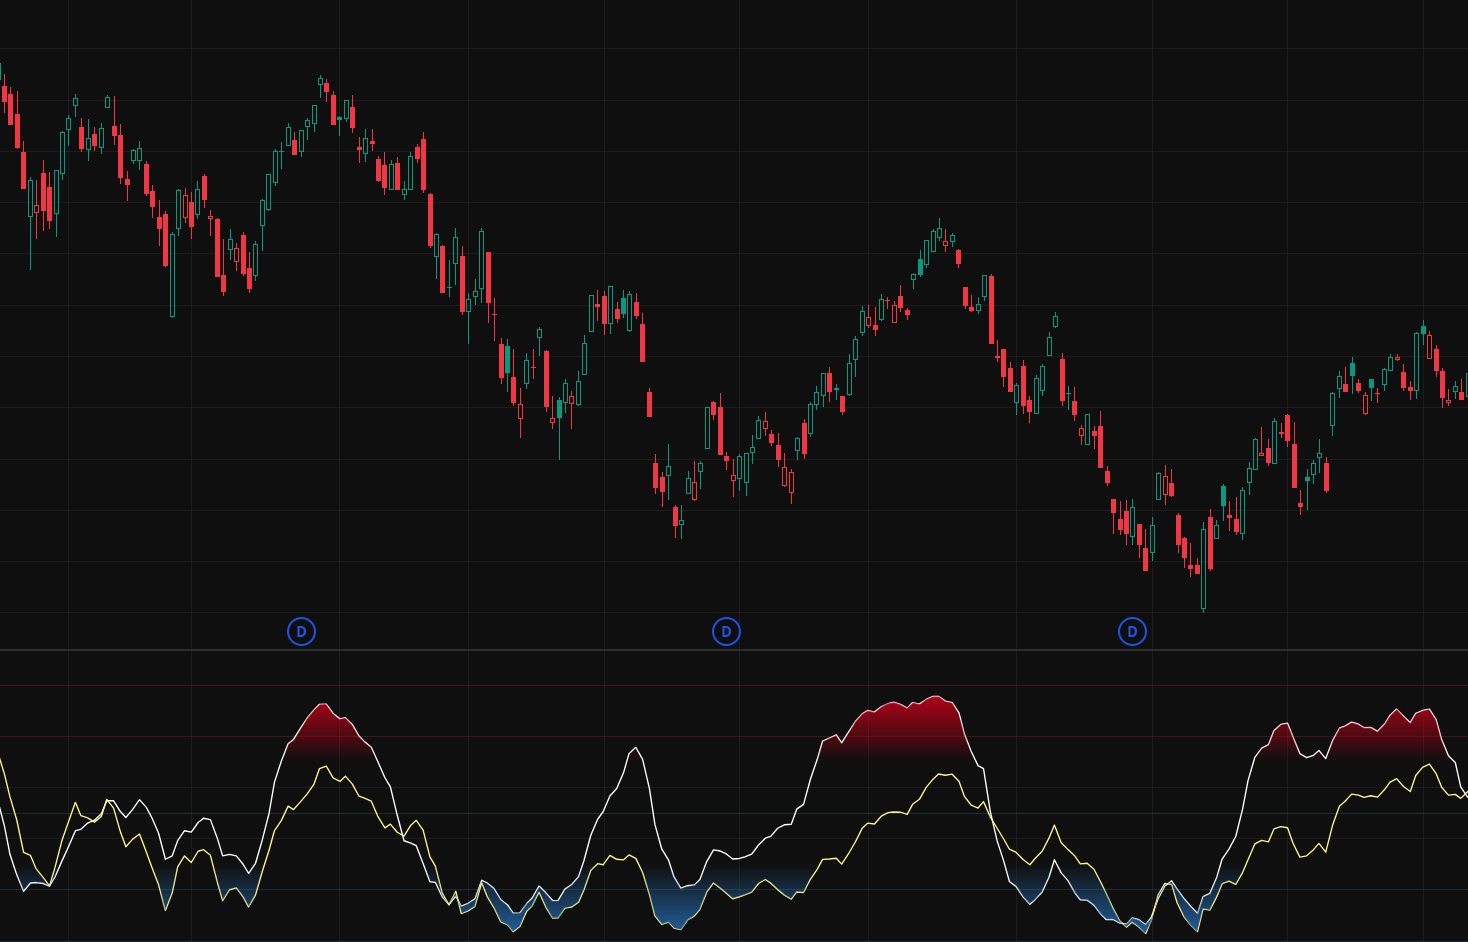
Double Trend Exhaustion™ Premium enhances traditional momentum analysis by computing
Williams %R across two distinct periods. The two line charts represent the 21-period and
112-period Williams %R values. The 21-period %R reflects short-term momentum shifts, while
the 112-period %R captures broader trend movements, providing a dual-perspective on market
conditions.
To eliminate unnecessary noise and smooth out erratic fluctuations, the indicator applies
exponential moving averages (EMAs) to both calculations.
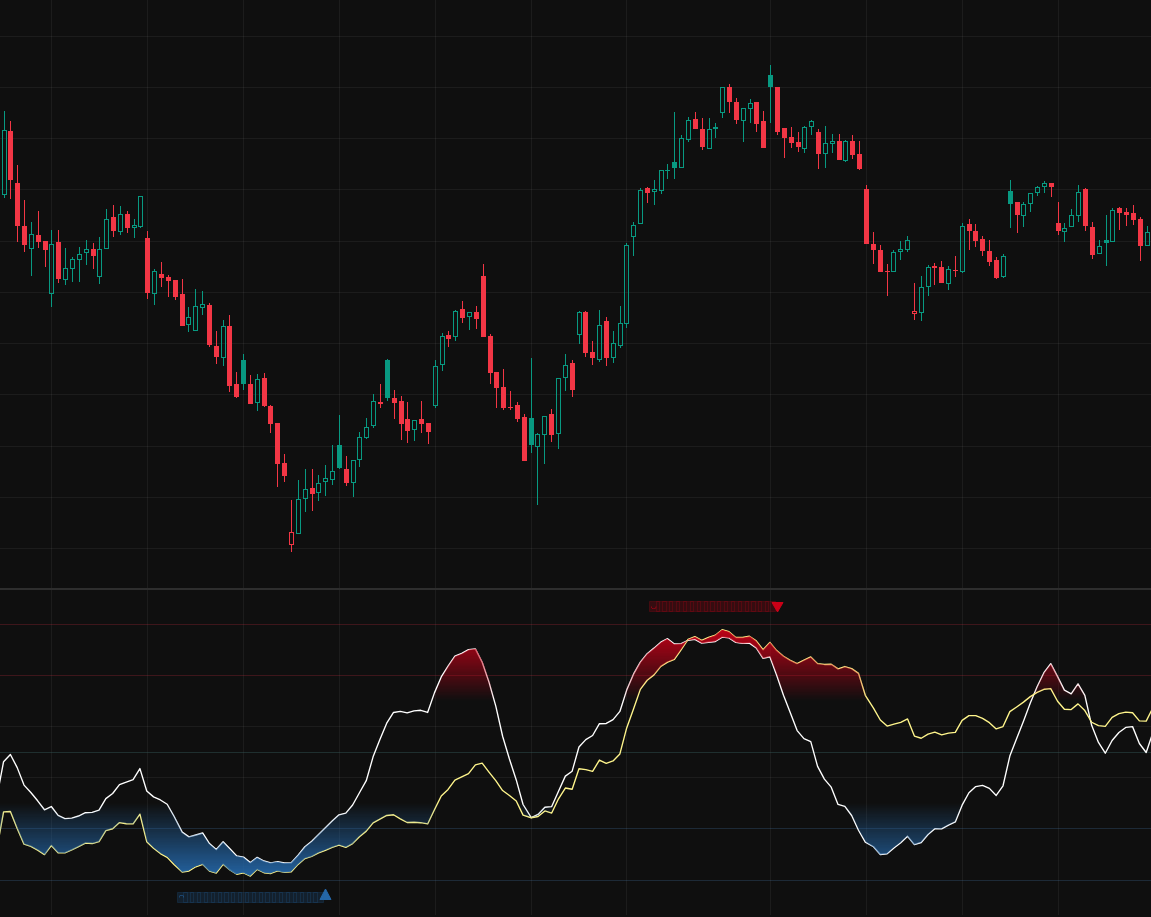
The core feature of this indicator is its ability to detect and respond to trend exhaustion. When an asset enters an overbought or oversold zone, the indicator issues preliminary warnings represented by square markers on the chart. These serve as alerts that the prevailing trend may be losing strength. Once the exhaustion phase fully plays out and momentum starts shifting, the indicator generates a triangular signal, marking a potential trend reversal.
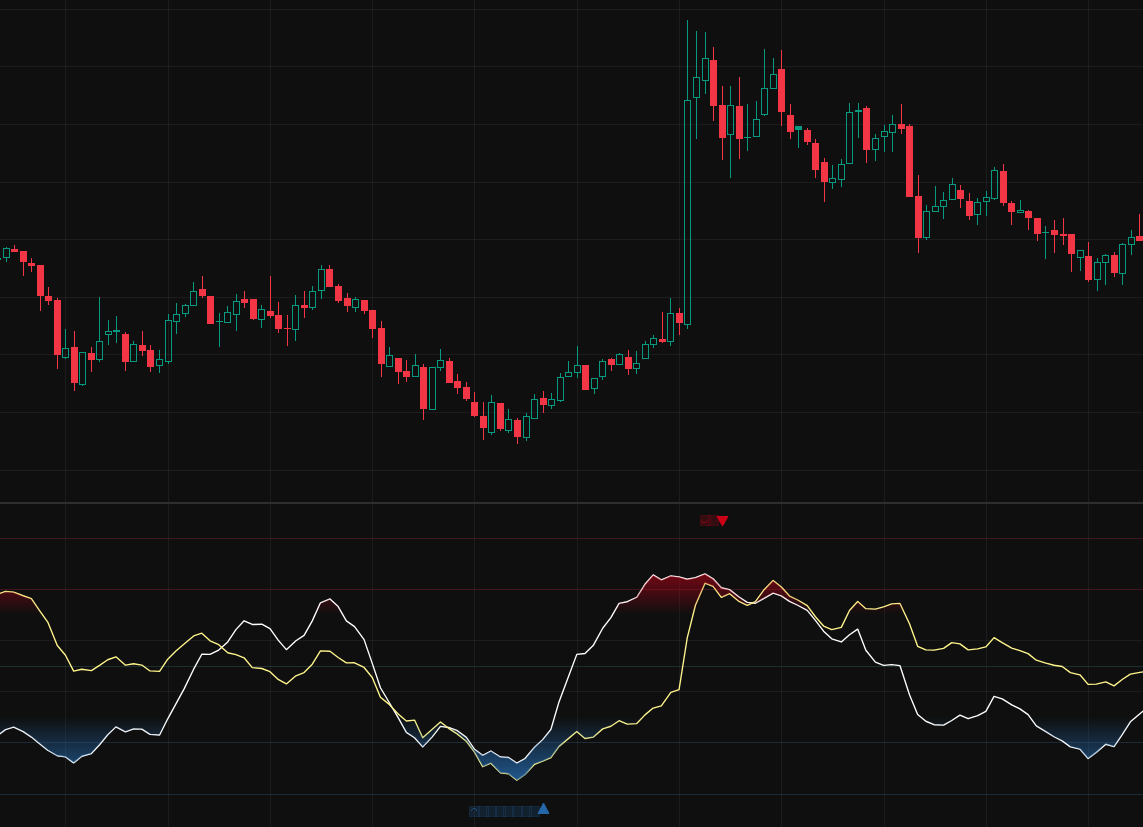
Traders should monitor the square markers as early warnings of possible exhaustion. An
actual reversal signal is confirmed only when the triangular marker appears, signifying that
the exhaustion phase has ended and a momentum shift may be underway.
For optimal results, this indicator should be used in conjunction with price action analysis,
key support and resistance levels, and volume confirmation. It is particularly effective for
momentum traders, swing traders, and mean-reversion strategies.