Volume Profile & VWAP, Explained
Volume Profile shows where volume traded across price levels, while VWAP shows the average traded price after weighting for volume. Both are standard market-structure tools on institutional desks, less for prediction than for understanding inventory, liquidity, and execution quality.
Volume traded at each price level
Volume Profile shows how much volume traded at each price level during a session or selected range. Instead of plotting volume only against time (the bottom-of-chart bars everyone knows), it turns trading activity into a horizontal histogram alongside the price axis. The result is a direct view of where the market spent the most time and did the most business.
The vocabulary is simple. High-volume nodes (HVNs) are price areas where activity was concentrated — the zones price tends to pause inside, consolidate around, and return to. Low-volume nodes (LVNs) are thin areas where less trading took place; when price enters them, it often moves quickly because there is little prior participation to absorb it. The tool does not tell you a level must hold. It shows where prior participation was heavy or thin.
For a liquidity provider the distinction is operational. An HVN is a zone where two-sided flow has been deep enough to rest inventory without taking on serious adverse selection. An LVN is where the arrival of a single sized order is far more likely to be informed — the place where quoted spreads widen, or where quotes get pulled altogether until the print clears. The point of control (POC) — the single price with the most traded volume in the window — is the gravitational center the LP defends most carefully, because it is where the most existing inventory was acquired.
Volume-weighted average price
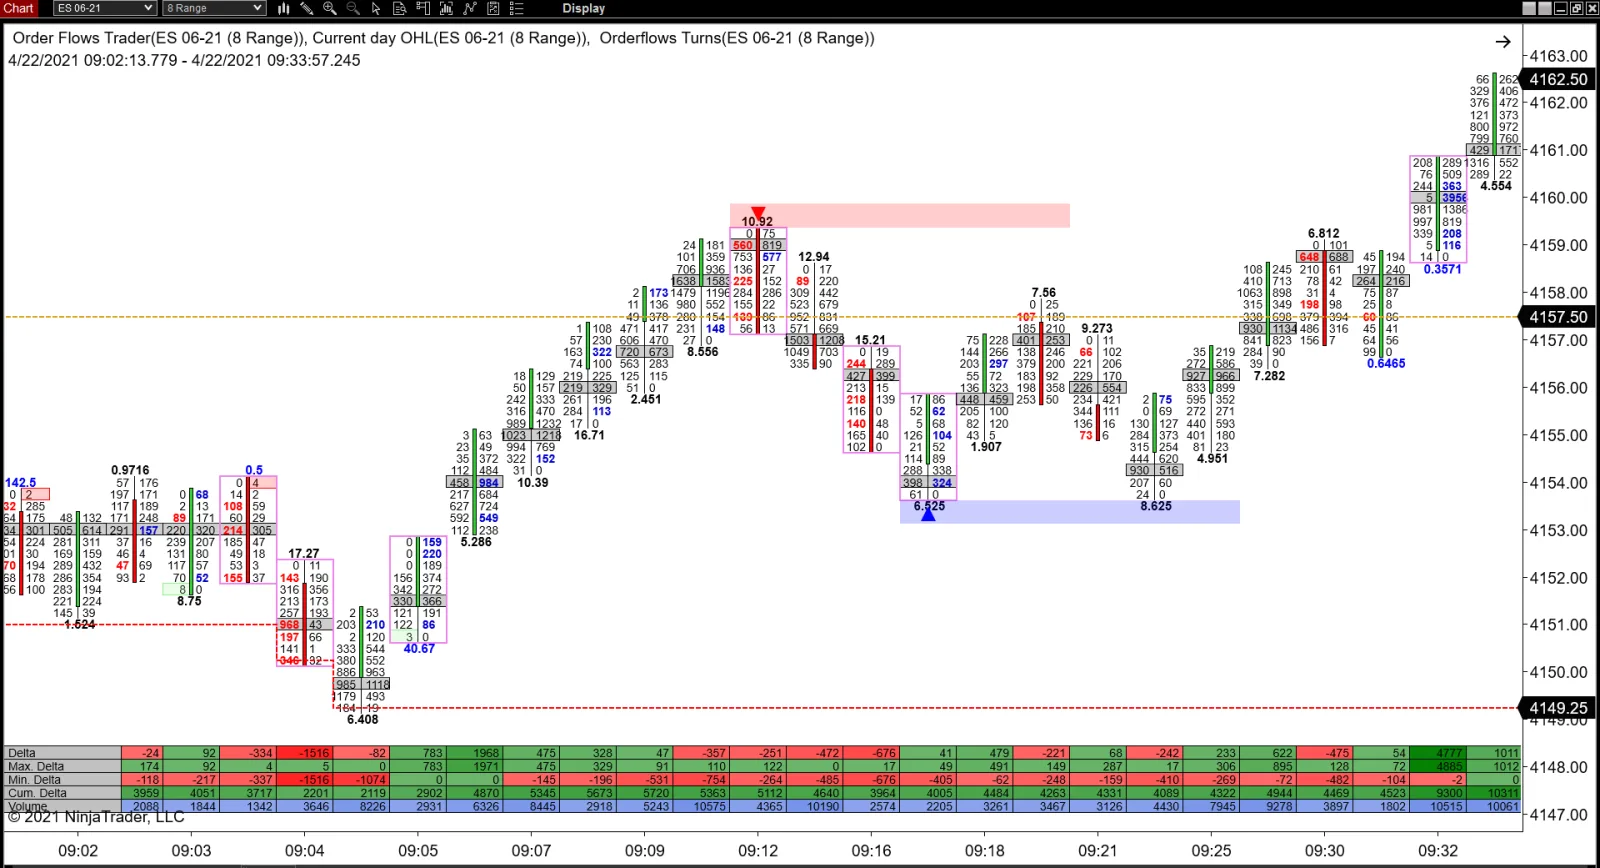
VWAP is the average price of a security over a period, weighted by how much volume traded at each price. The calculation: multiply each trade's price by its volume, sum those values across the chosen window, divide by total volume. Heavier-volume prices count more than lighter-volume prices — so VWAP shows where activity has actually centered, not just the simple average of price.
This is why VWAP is the canonical benchmark for institutional execution. A buy-side desk grading a VWAP-tracking execution algo, or a market maker reviewing fill quality post-trade, both express the answer the same way: basis points above or below VWAP. Transaction cost analysis reports are built around it. An LP that consistently fills better than arrival-time VWAP is providing liquidity at a profit; one that fills worse is paying for flow it should have passed on.
On the chart, price above VWAP suggests buyers are paying above the session's volume-weighted center; price below VWAP suggests the opposite. Standard-deviation bands around the VWAP line show how far price has stretched from that center, giving a simple way to compare current action with the session's structure.
For intraday traders, VWAP is a working tool: it frames whether price is extended on the day. For longer-horizon ETF investors, it is mainly background context — a reminder that price is always being negotiated around where volume actually traded, not around a chart pattern.
From market structure to a dated signal.
Volume Profile and VWAP help explain where activity sits on a chart. DoubleTrends™ turns a different question into an alert: when the S&P 500 index's oversold selling has exhausted itself inside a stressed regime, for ETF investors using funds such as VOO, SPY, or IVV.
Educational note
Volume Profile and VWAP are standard market-structure tools used on institutional execution desks and across every major charting platform. Educational information only — not financial, investment, or trading advice.