Maximum Drawdown
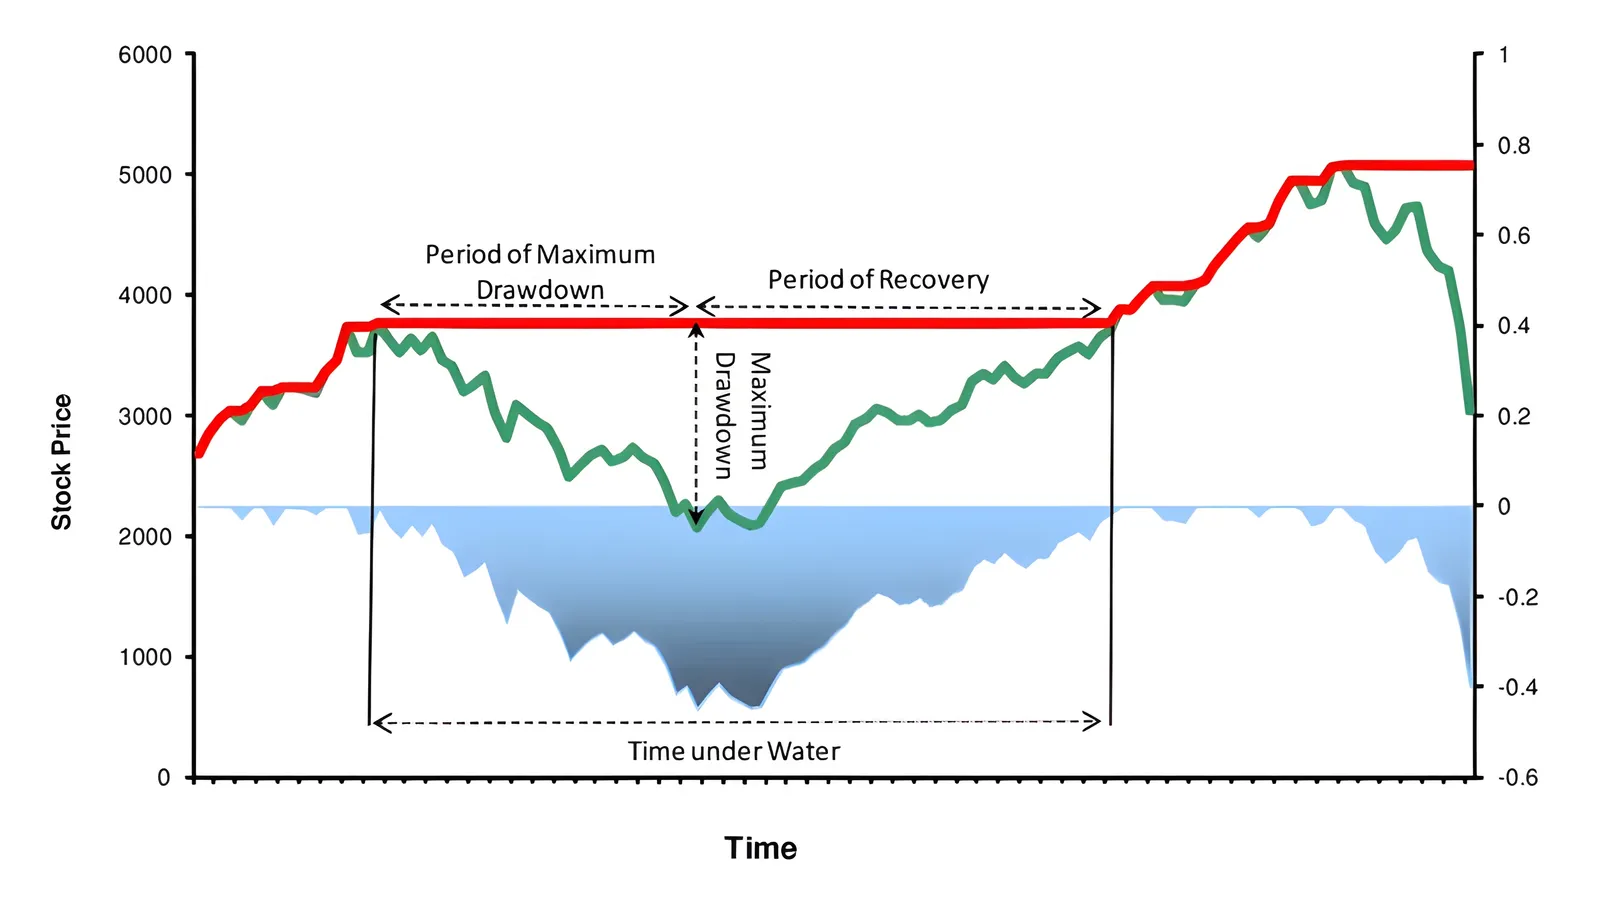
Maximum drawdown measures how far the market has fallen below a recent high. In practice, that number becomes much more useful when you read it alongside duration and sharpness: the same 10% drop means something very different if it took two weeks instead of six months, or if the worst leg was sudden instead of gradual.
Depth from a trailing high
The drawdown on any given day is just one subtraction: today's close, expressed as a percentage below the highest close inside some lookback window. Pick a window, find the high, compare to today, report the percentage.
The crucial choice is the window. Drawdown from an all-time high tells you something about long-run market memory but reacts slowly; drawdown from a 10-day high reacts instantly but is mostly noise. The DoubleTrends™ engine measures drawdown from a trailing one-year high. One year is long enough to ignore weekly chop and short enough that the “recent peak” is still relevant to today's market psychology.
Duration changes the meaning
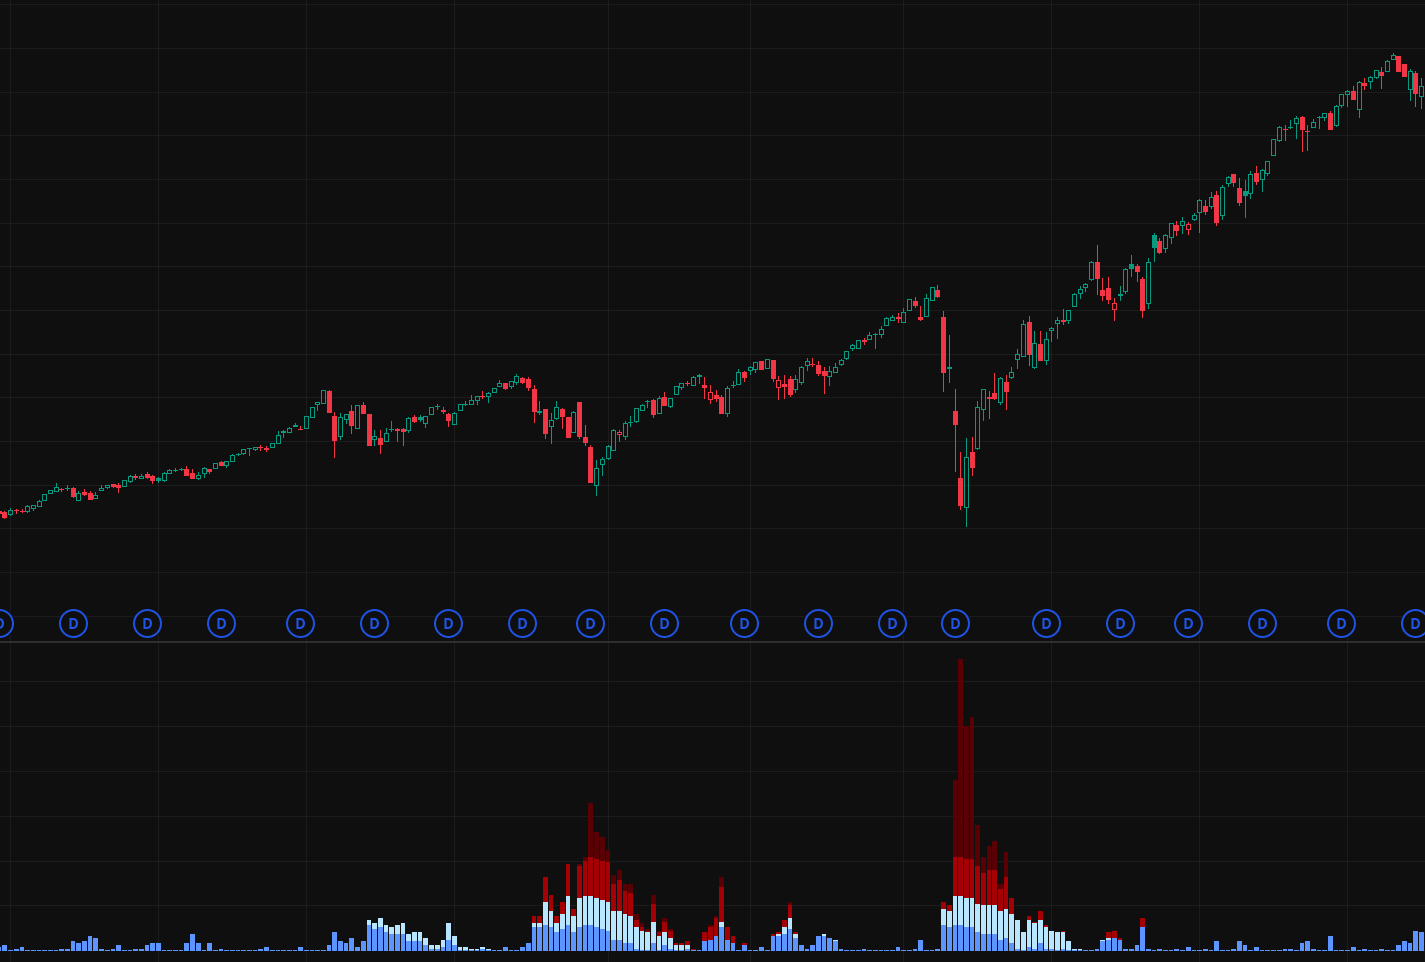
Depth alone is misleading. Consider two markets both sitting at −15%:
Down 15% in three weeks
A sudden shock. Forced de-risking, vol spiking, headlines screaming. This is the panic pattern, where buying-the-dip has historically paid.
Down 15% over seven months
A grinding bleed. Earnings revisions, macro deterioration, structural selling. This is the bear pattern, where false bottoms are common.
The depth is identical. The market is structurally different. The discipline is to look at both axes at once — depth and duration — instead of letting the percentage speak alone.
The engine tracks duration as the time elapsed since the trailing one-year high. Short duration with deep depth maps to panic. Long duration with deep depth is one of the inputs the bear overlay watches for.
Sharpness: how brutal was the worst stretch
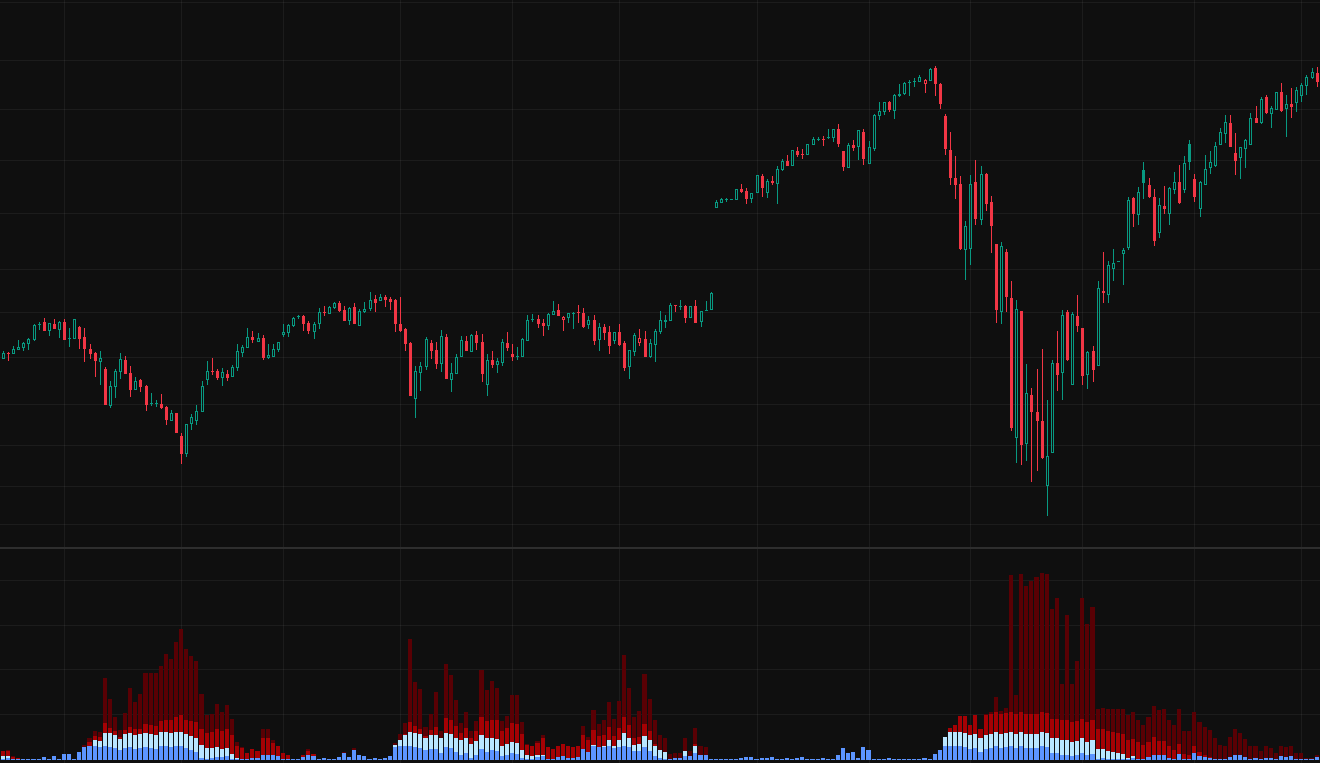
Depth and duration describe the envelope of the selloff. Sharpness describes its texture. Two drawdowns can be the same depth and duration but feel very different if one was a steady glide down and the other was a single, vicious week.
The engine captures this by looking at the worst ten-day stretch within the trailing month. A market that has just absorbed a brutal ten-day leg down is being repriced by panic flow, even if the headline drawdown is modest. A market that drifted to the same depth over months has not.
Three numbers, one regime read
Depth, duration, and sharpness are not the final answer. They are three of the inputs the regime classifier reads to decide whether a market is in calm, correction, panic, or bear. The shape of how they combine:
shallow depth, calm sharpness
Calm or correction. No signal eligibility — the engine refuses to fire here.
off the recent ceiling + acute sharpness
Panic candidate. The engine becomes eligible to fire on a Williams %R reversal.
deep depth + long duration + macro pressure
Bear regime. Fires allowed, but only after a harder confirmation bar.
These shapes do not stand alone — they combine with VIX, Fed funds, unemployment, and CPI to produce the final regime read. Drawdown is the inside view: how stressed price is on its own. The macro anchors are the outside view: whether the rest of the world agrees. The exact thresholds that turn each shape on or off are part of the production rule and are not published.
From “how deep” to “now.”
Drawdown describes the environment. DoubleTrends™ turns the dip thesis into a dated alert — one message when the rule's three gates clear on the S&P 500 index. Built for ETF investors using funds such as VOO, SPY, or IVV.
See the productMethod
Drawdown is computed from S&P 500 price index daily closes (^GSPC) against a trailing one-year high. Duration is measured as time since that high. Sharpness reads the worst ten-day stretch within the trailing month. Exact threshold values used inside the regime classifier are part of the production logic and are not published. Educational information only — not financial, investment, or trading advice. Past performance does not guarantee future results.