The DoubleTrends™ Signal
Double trend exhaustion means downside momentum has stretched so far, on both a short clock and a long clock, that both start turning back up out of deep oversold territory together. DoubleTrends™ expresses that idea with a fifty-year-old indicator, Williams %R, run on two horizons at once and smoothed before the trigger is allowed to fire.
Williams %R, in one formula
Larry Williams introduced %R in 1973 as a momentum oscillator for futures markets. The whole indicator collapses to a single equation:
%Rn = ((HighestHighn − Close) / (HighestHighn − LowestLown)) × −100
Read in English: take the highest high over the past n bars and the lowest low over the same window. Where does today's close sit inside that range? Express it as a percentage, then flip the sign so the indicator is bounded between −100 (close at the low) and 0 (close at the high).
That is the whole tool. There is nothing fancy underneath — no machine learning, no proprietary normalization, no Fed model. Just “where in the recent range did we close, on a fixed scale.”
Close to −100 means exhausted
The convention is that %R values near −100 indicate an oversold market — the close is pinned to the bottom of its recent range — and values near 0 indicate an overbought market. Practitioners typically draw two horizontal threshold lines (commonly −80 and −20) and treat readings beyond them as the working extremes.
Williams %R is in the same family as RSI and Stochastics. All three answer the same general question (“is price stretched relative to its recent range?”) with slightly different math. %R uses the simplest version: the close inside the high-low envelope, no internal smoothing, no rate-of-change calculation. That simplicity is part of why it is durable.
Noisy or laggy — pick one
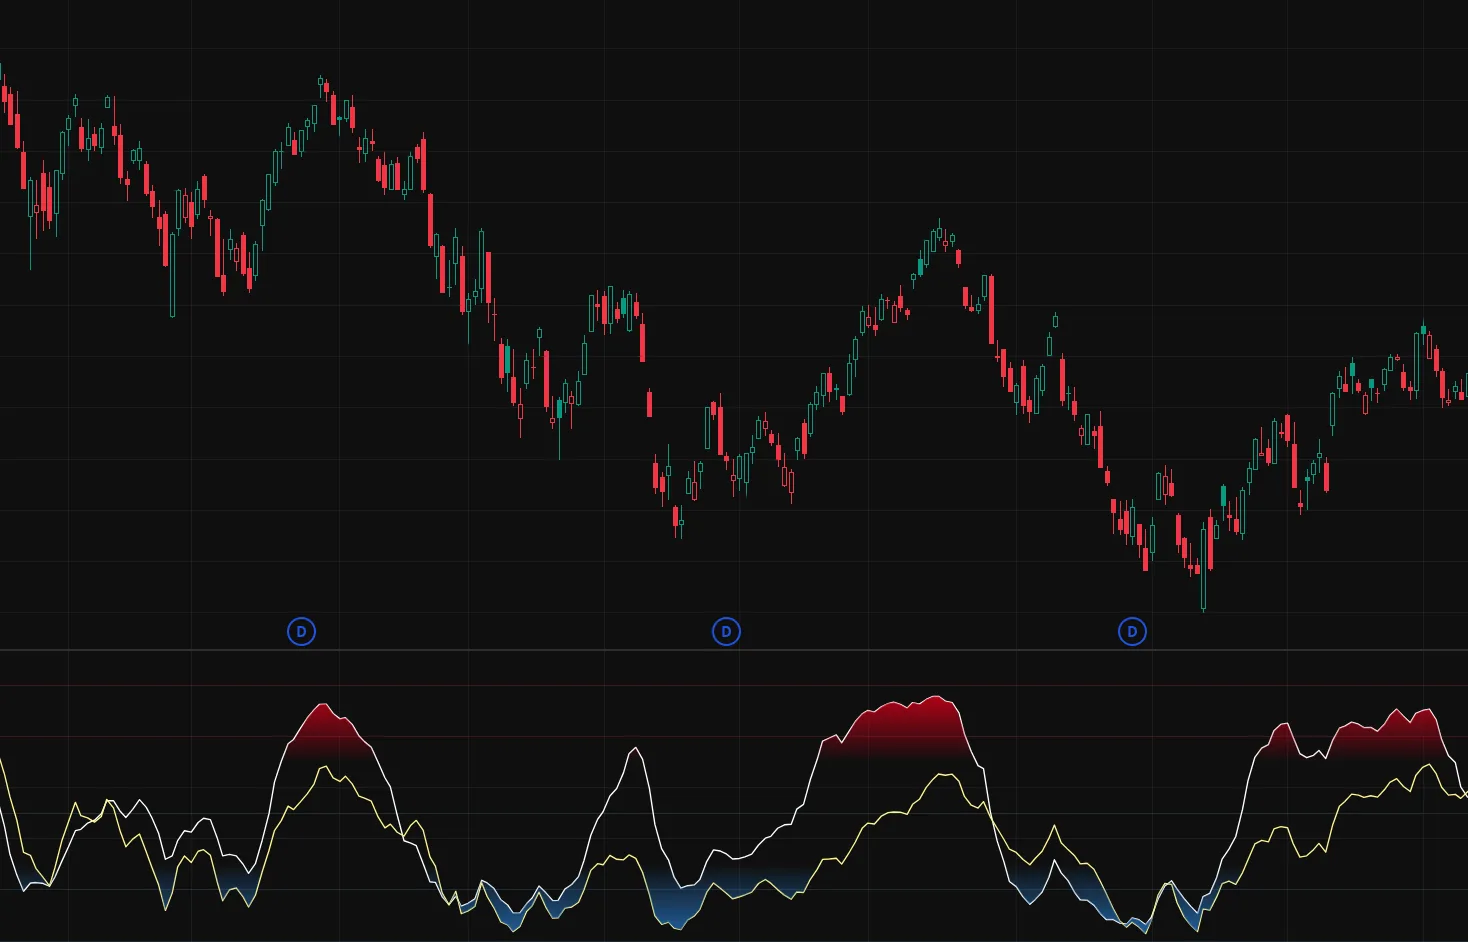
Run %R on a single window and you are forced into a tradeoff. A short window reacts quickly. It catches every minor pullback, including the ones that mean nothing, and it pings into “oversold” on routine 2–3% dips. A long window ignores small wobbles but lags badly: by the time the indicator confirms an oversold turn, the bounce is already weeks old.
This is the same dilemma every momentum tool faces. The honest answer is that no single window length is right for both noise rejection and timeliness. You either accept false alarms, or you accept being late.
EMA over the raw line
Raw Williams %R is jagged. A single down day can push it from −60 to −95 and back. Acting on the raw value means acting on noise. The standard fix is to smooth %R with an exponential moving average (EMA), which weights recent values more heavily than older ones. An EMA dampens day-to-day chop without adding much lag — the line still bends at the same time, it just stops shaking.
The DoubleTrends™ engine smooths both of its %R lines this way. The shapes do not change, but the noise floor drops, and the threshold crossings become meaningful.
The short clock and the long clock
The core idea of DoubleTrends™ is to stop picking between “noisy and fast” vs “clean and slow” — and to require both at once. The engine runs %R on two windows and smooths each:
A shorter %R window, smoothed. Reads short-horizon momentum — catches the near-term stretch and the near-term turn.
A longer %R window, smoothed. Reads the broader trend — stretches only on persistent weakness, not on a three-day wobble.
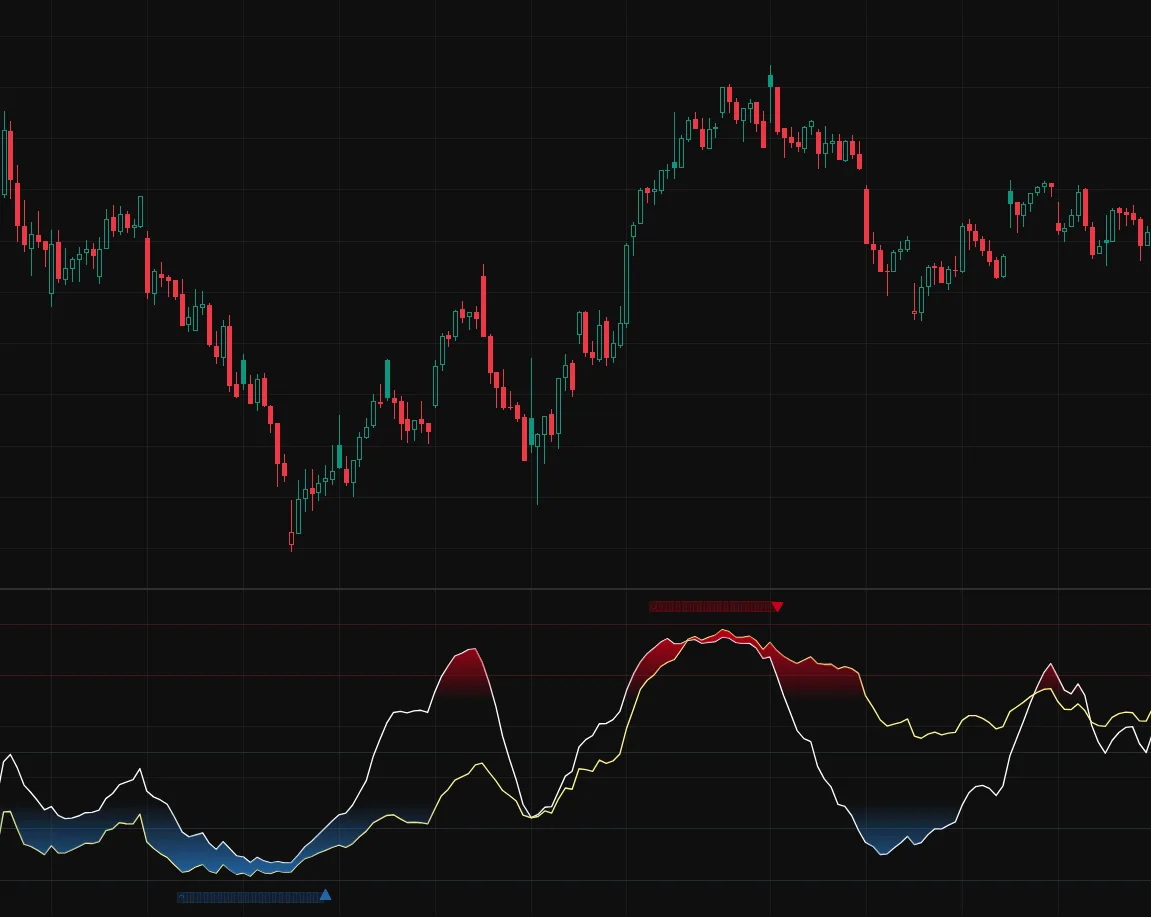
When both lines sit at or below the deep-oversold threshold, the market is exhausted on the short clock and the long clock simultaneously. One alone is noise; both together is structural stress.
Oversold first, then the turn
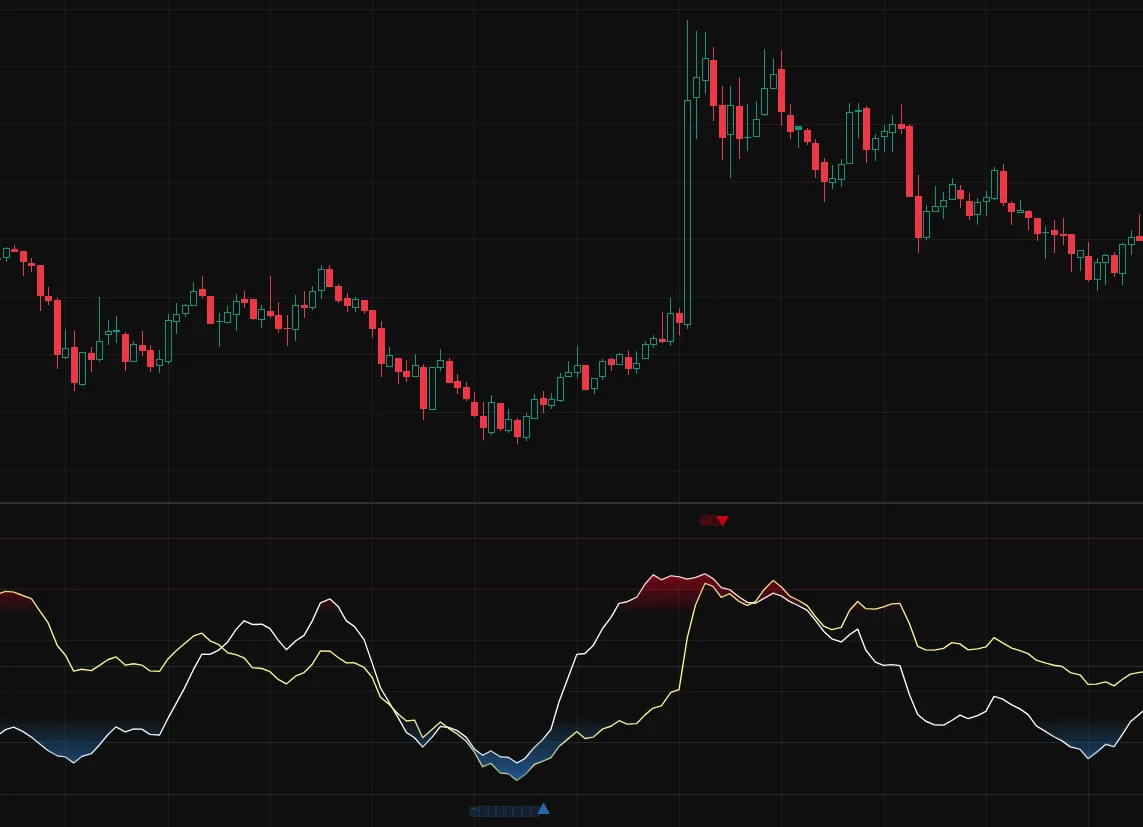
Deep-oversold by itself is a warning, not a signal. Markets can stay oversold for weeks. The actual DoubleTrends™ trigger is the exit: the bar where both smoothed %R values rise back above the deep-oversold threshold after having sat below it on the prior bar.
That moment — not the descent into oversold — is what gets passed up to the regime gate and the confirmation gate. This matters because waiting for the turn instead of the entry kills a class of false alarms automatically. Markets that go deeply oversold and stay there do not fire. Only the ones that bend back up do.
A dip-buying tool, not a top-caller
Williams %R is symmetric — it computes overbought extremes near 0 as cleanly as oversold extremes near −100. DoubleTrends™ ignores the overbought half entirely. The reason is empirical: on broad-index daily charts, oversold reversals carry strong forward expected returns; overbought reversals do not. Markets can stay overbought for years (look at any structural bull run) without producing exploitable reversals. The asymmetry of long-only equity drift is the reason.
So the engine reads only the side where the math has historically paid. It is a dip-buying tool, not a top-calling tool.
The reversal is one of three gates
A raw reversal candidate by itself is not the customer-facing signal. The full product layers two more gates on top: a four-state regime classifier that throws out reversals in calm or correction markets, and a confirmation gate that requires more evidence in bear regimes than in panic regimes.
Williams %R, doubled, is what fires the candidate. The regime classifier decides whether to listen. The confirmation gate decides whether the candidate is strong enough to publish.
Get the signal, not the screen-watching.
DoubleTrends™ tracks the S&P 500 index every day and sends a single alert when the dual Williams %R reversal clears its regime and confirmation gates — built for ETF investors using funds such as VOO, SPY, or IVV. The goal is not to guess the exact bottom. It is to make the moment visible when the rule says selling has exhausted itself.
See the productReference & method
Williams %R is a standard momentum oscillator introduced by Larry Williams (1973). For a third-party reference, see Fidelity's Williams %R guide. The DoubleTrends™ implementation uses two smoothed timeframes — a short clock and a long clock — and only acts on the bar that crosses back out of a deep-oversold zone on both clocks at once. Exact window lengths, smoothing constants, threshold values, regime parameters, and confirmation rules are part of the production logic and are not published. Educational information only — not financial, investment, or trading advice. Past performance does not guarantee future results.