Double Trend Exhaustion™ Indicator
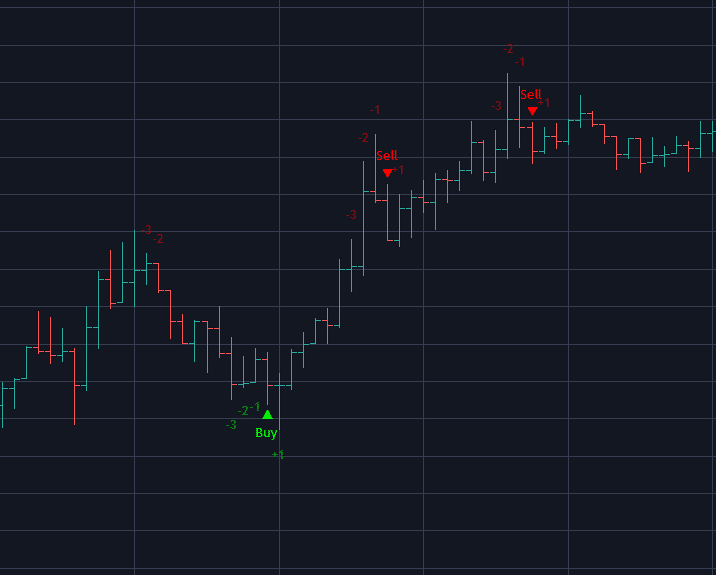
1. First Step: Countdown
As momentum begins to build, a dynamic countdown -3, -2,
-1 starts to appear, signaling that the market is
shifting. This early-stage indicator tracks sustained
directional pressure, and as the trend intensifies over
nine consecutive periods, it reaches a critical
exhaustion point, ready to trigger a powerful reversal
signal.
As shown in the graph, the -3, -2, -1 countdown
progressively builds up, leading to a signal trigger as
momentum exhaustion is confirmed.
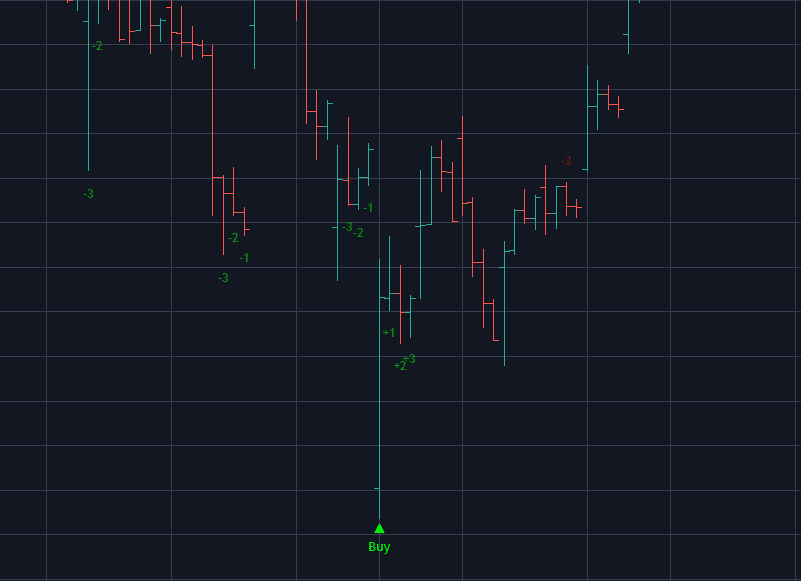
2. Second Step: Setup
When a buy or sell signal is triggered, evaluate if the
corresponding candlestick breaks through the -3 and -2
levels. If it does, the setup aligns with optimal trend
exhaustion parameters, signaling a high-probability
reversal. If not, the market may sustain its directional
momentum, indicating the possibility of continued trend
progression before a potential reversal.
As demonstrated in the graph, this represents an optimal
setup, where the candlestick breaks through the -3 and
-2 levels, confirming a high-probability reversal under
current market conditions.
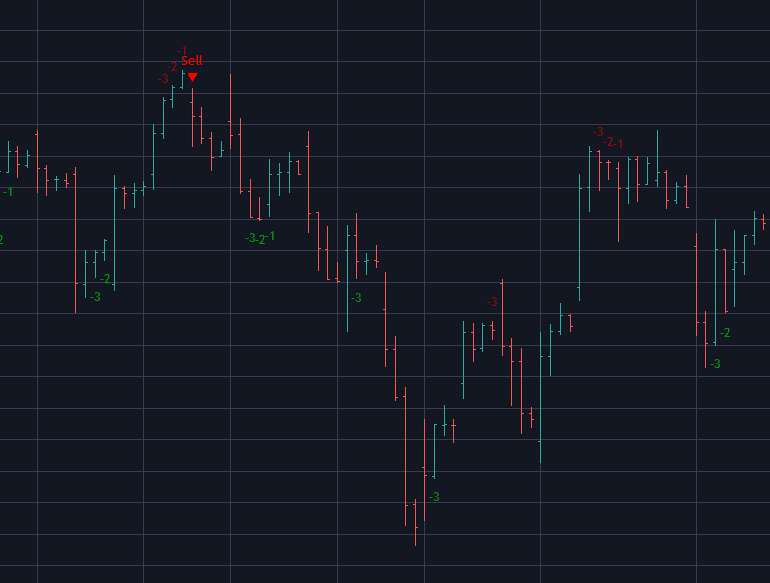
3. Third Step: Monitor
The third step involves validating the trend reversal
signal by analyzing the three subsequent candlesticks.
If +1, +2, or +3 appear, it signifies residual momentum
persistence, suggesting the trend may extend before
exhaustion. However, if no continuation markers emerge,
it confirms a definitive momentum shift, reinforcing the
reversal signal with high statistical confidence.
The graph illustrates a sell signal followed by the
absence of +1, +2, or +3, confirming an immediate trend
reversal upon signal activation.
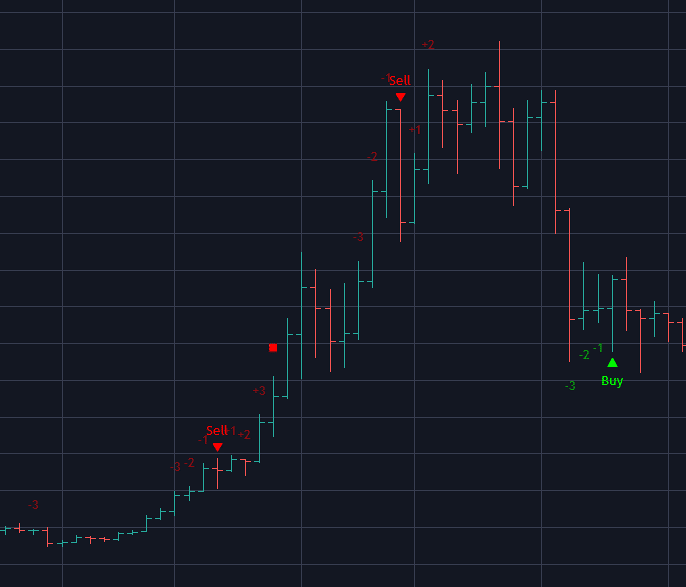
4. "Double" Trend Exhaustion
Sometimes, the trend persists despite a signal,
especially in high-volatility, emotion-driven markets
like crypto. To counter this, a small square appears
after +1, +2, +3, marking a chase-back phase. The
counter then continues, and if the trend sustains for
2×9 = 18 consecutive periods, the reversal signal
re-triggers. Hence, the name Double Trend Exhaustion.
The graph shows Bitcoin during its 2021 bull cycle on
the weekly timeframe. As seen, the trend wasn’t
exhausted after the first signal due to hyped-up FOMO
emotions, triggering the chase-back fail-safe. The trend
was “double” exhausted after 18 consecutive weeks,
confirming the final reversal.